Math Gaming Club 2019

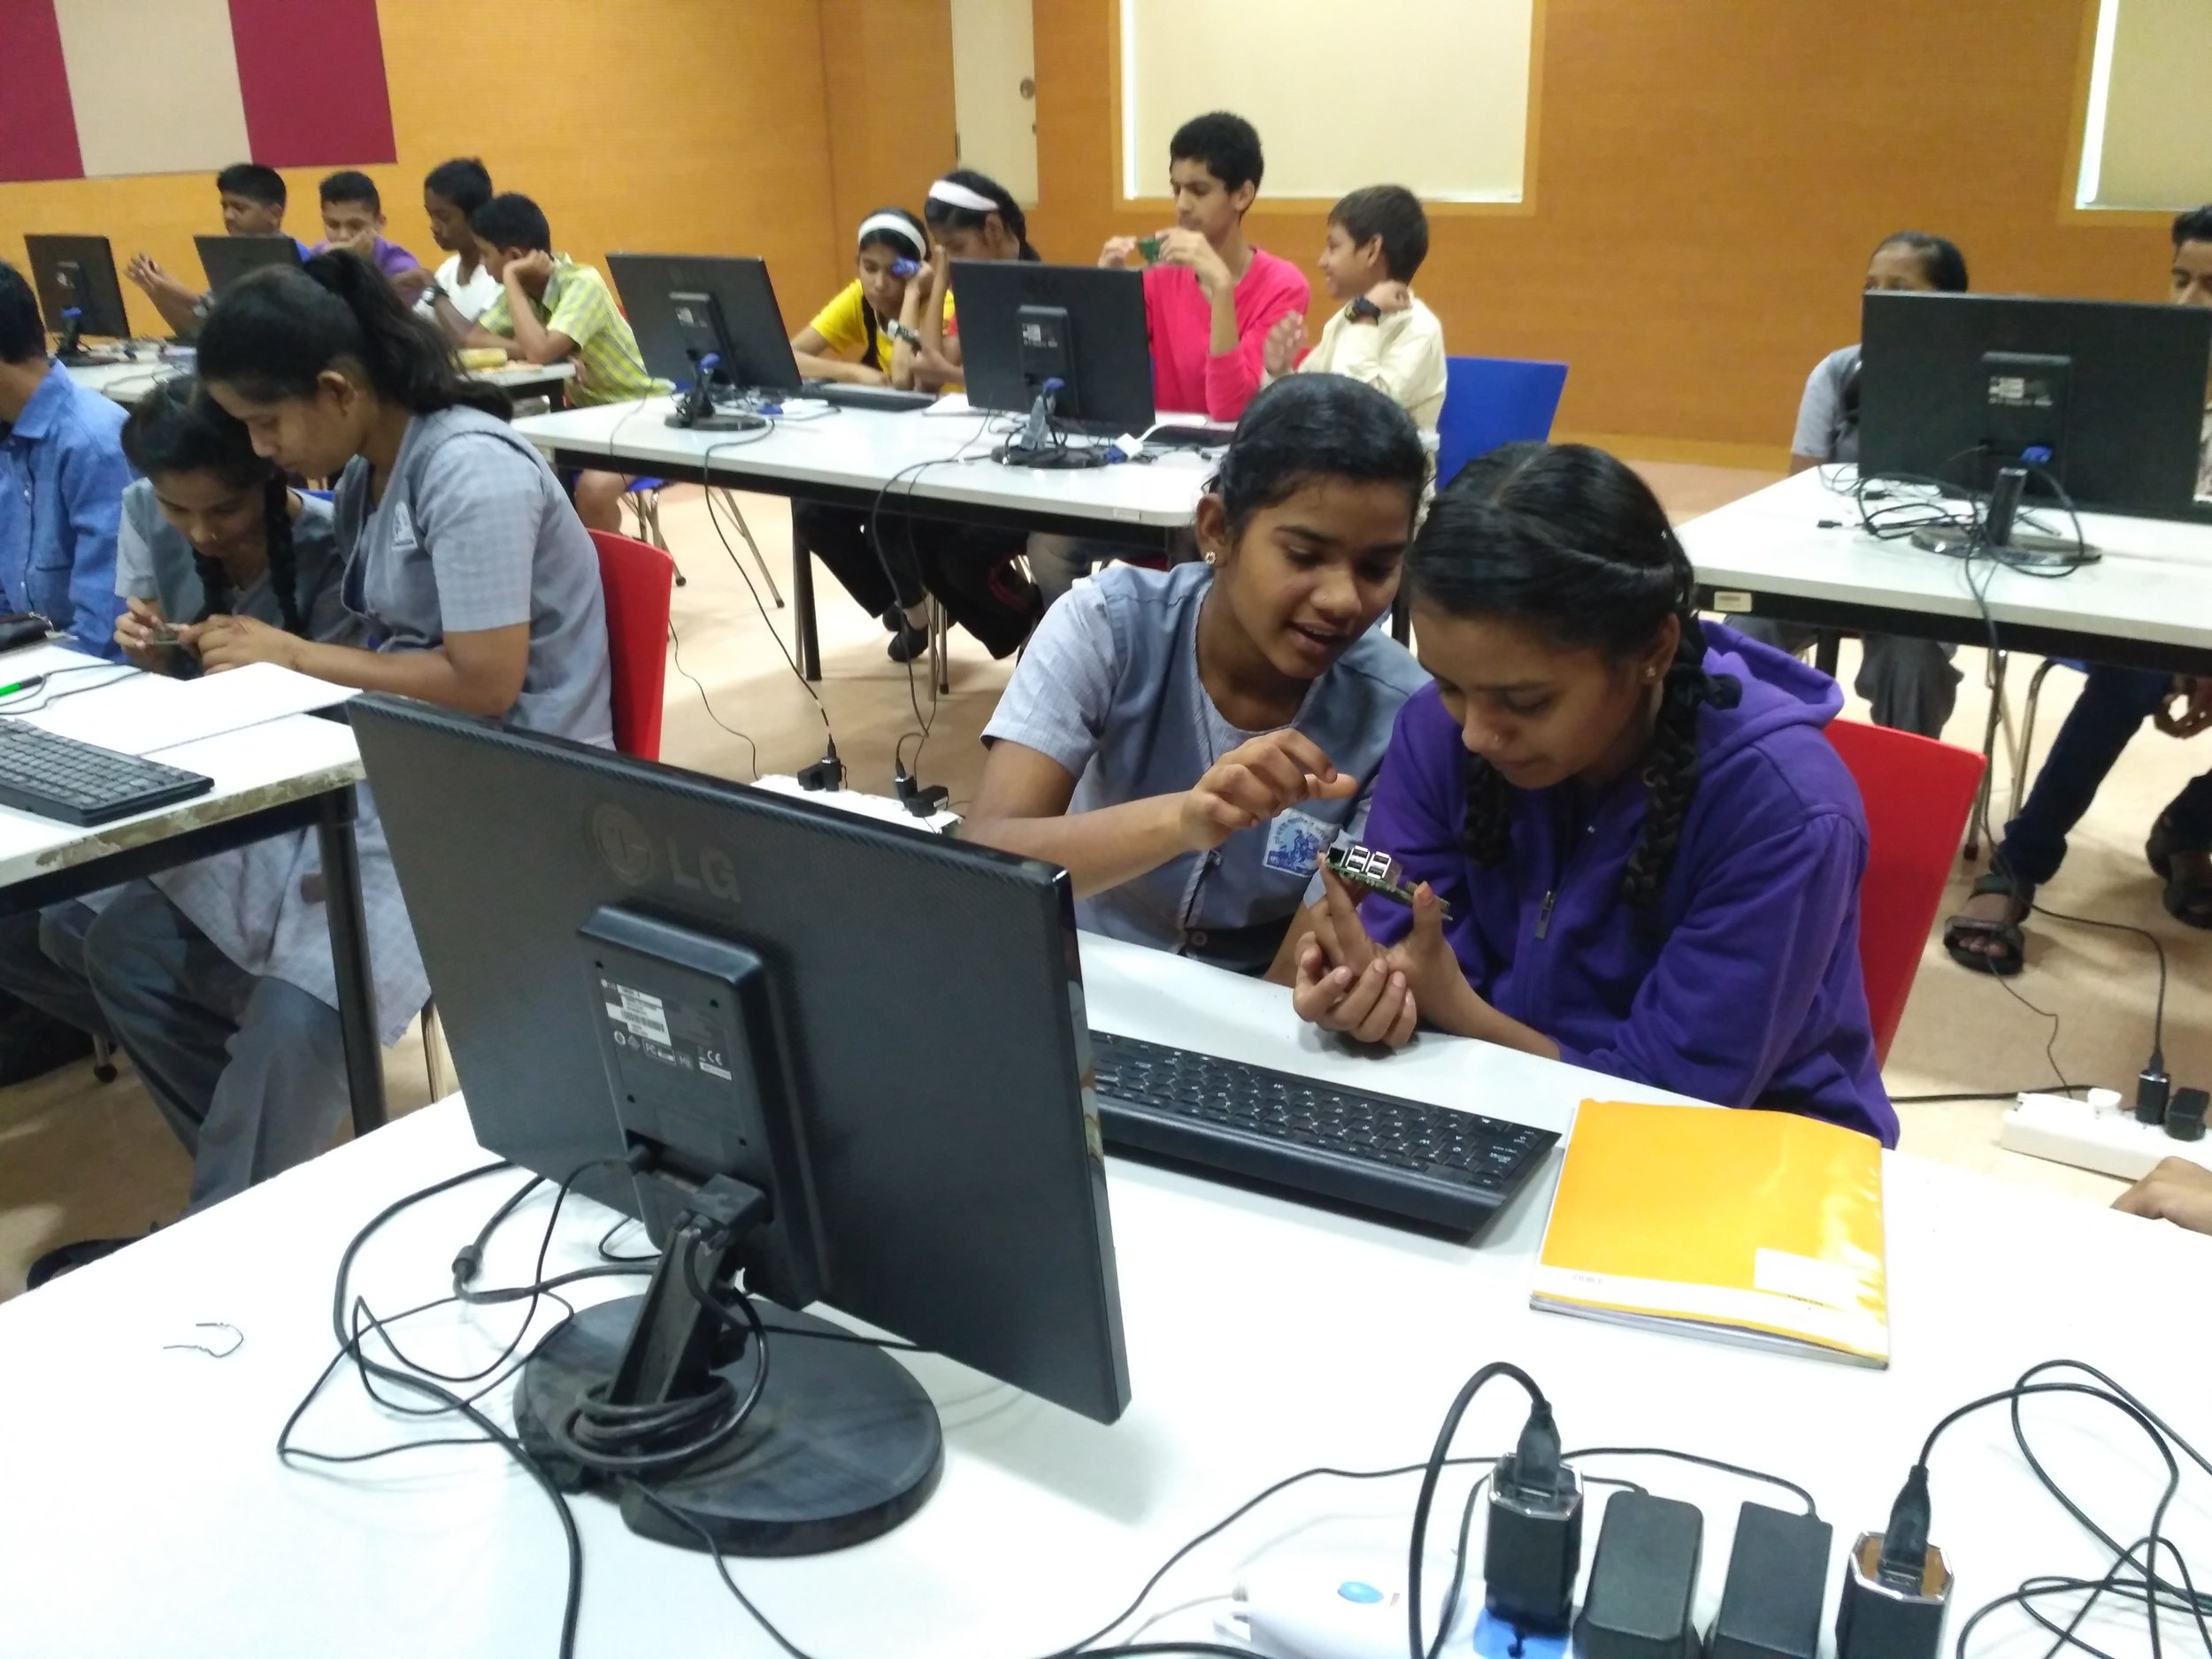
The Tinkering Lab at NCL Innovation Park has been arranging a “Math Gaming Club” workshop for a while now. I have been part of these workshops [in minor and major capacity] for the last couple of years. It’s always fun to interact with the kids, especially the younger ones. They never cease to amaze as well as amuse me. The existing school curriculum and pedagogy really fails to teach the beauty and essence of mathematics; in fact, it rather creates an intimidation about the subject. At “Math Club”, we endeavor to create those [otherwise missing] “Aha” moments in an intellectually and creatively stimulated environment. The interaction with the younger kids, their bubbling enthusiasm coupled with innocent naivete is refreshing for me with my otherwise brutally spartan routine [thanks to my two startups]. And this year was no exception, we just finished a ten-day long workshop last Friday. We usually expect kids from 10 to 18 years of age to attend the workshop but this year we had one 8-year-old girl who was quite excited about the workshop. And to our surprise she did extremely well in almost all the sessions. Perhaps we should allow more younger ones to participate from next year.     

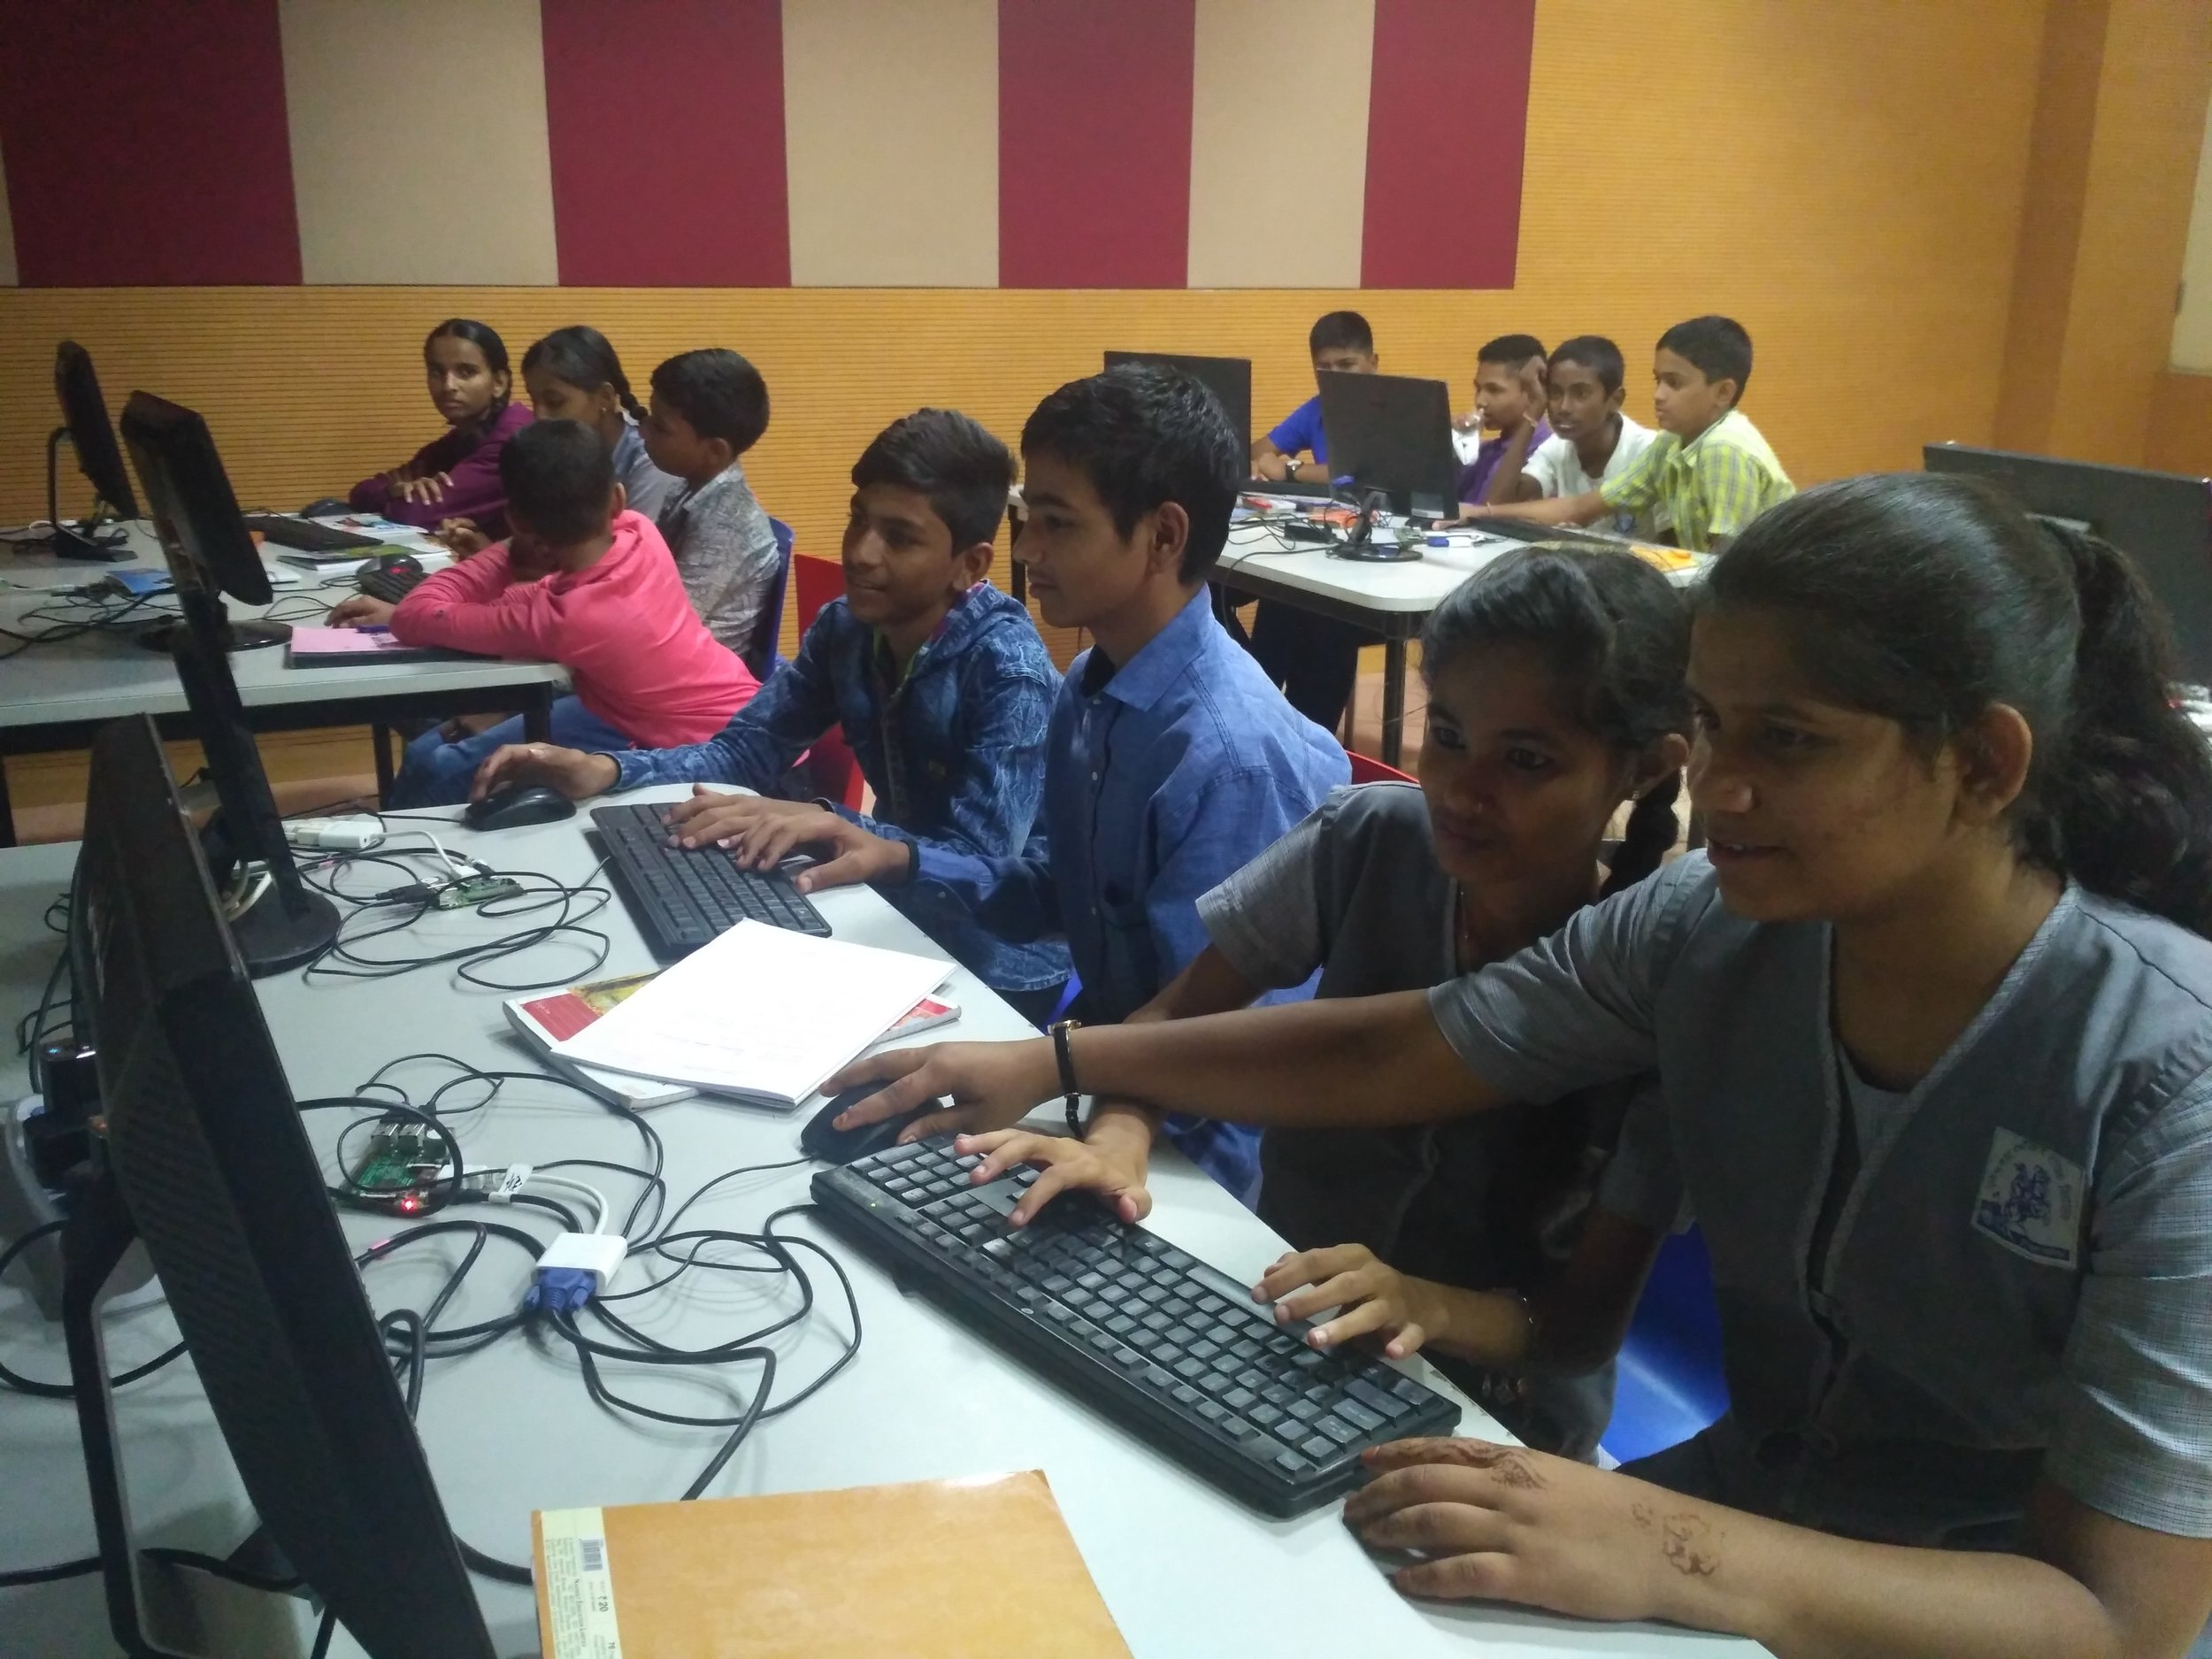
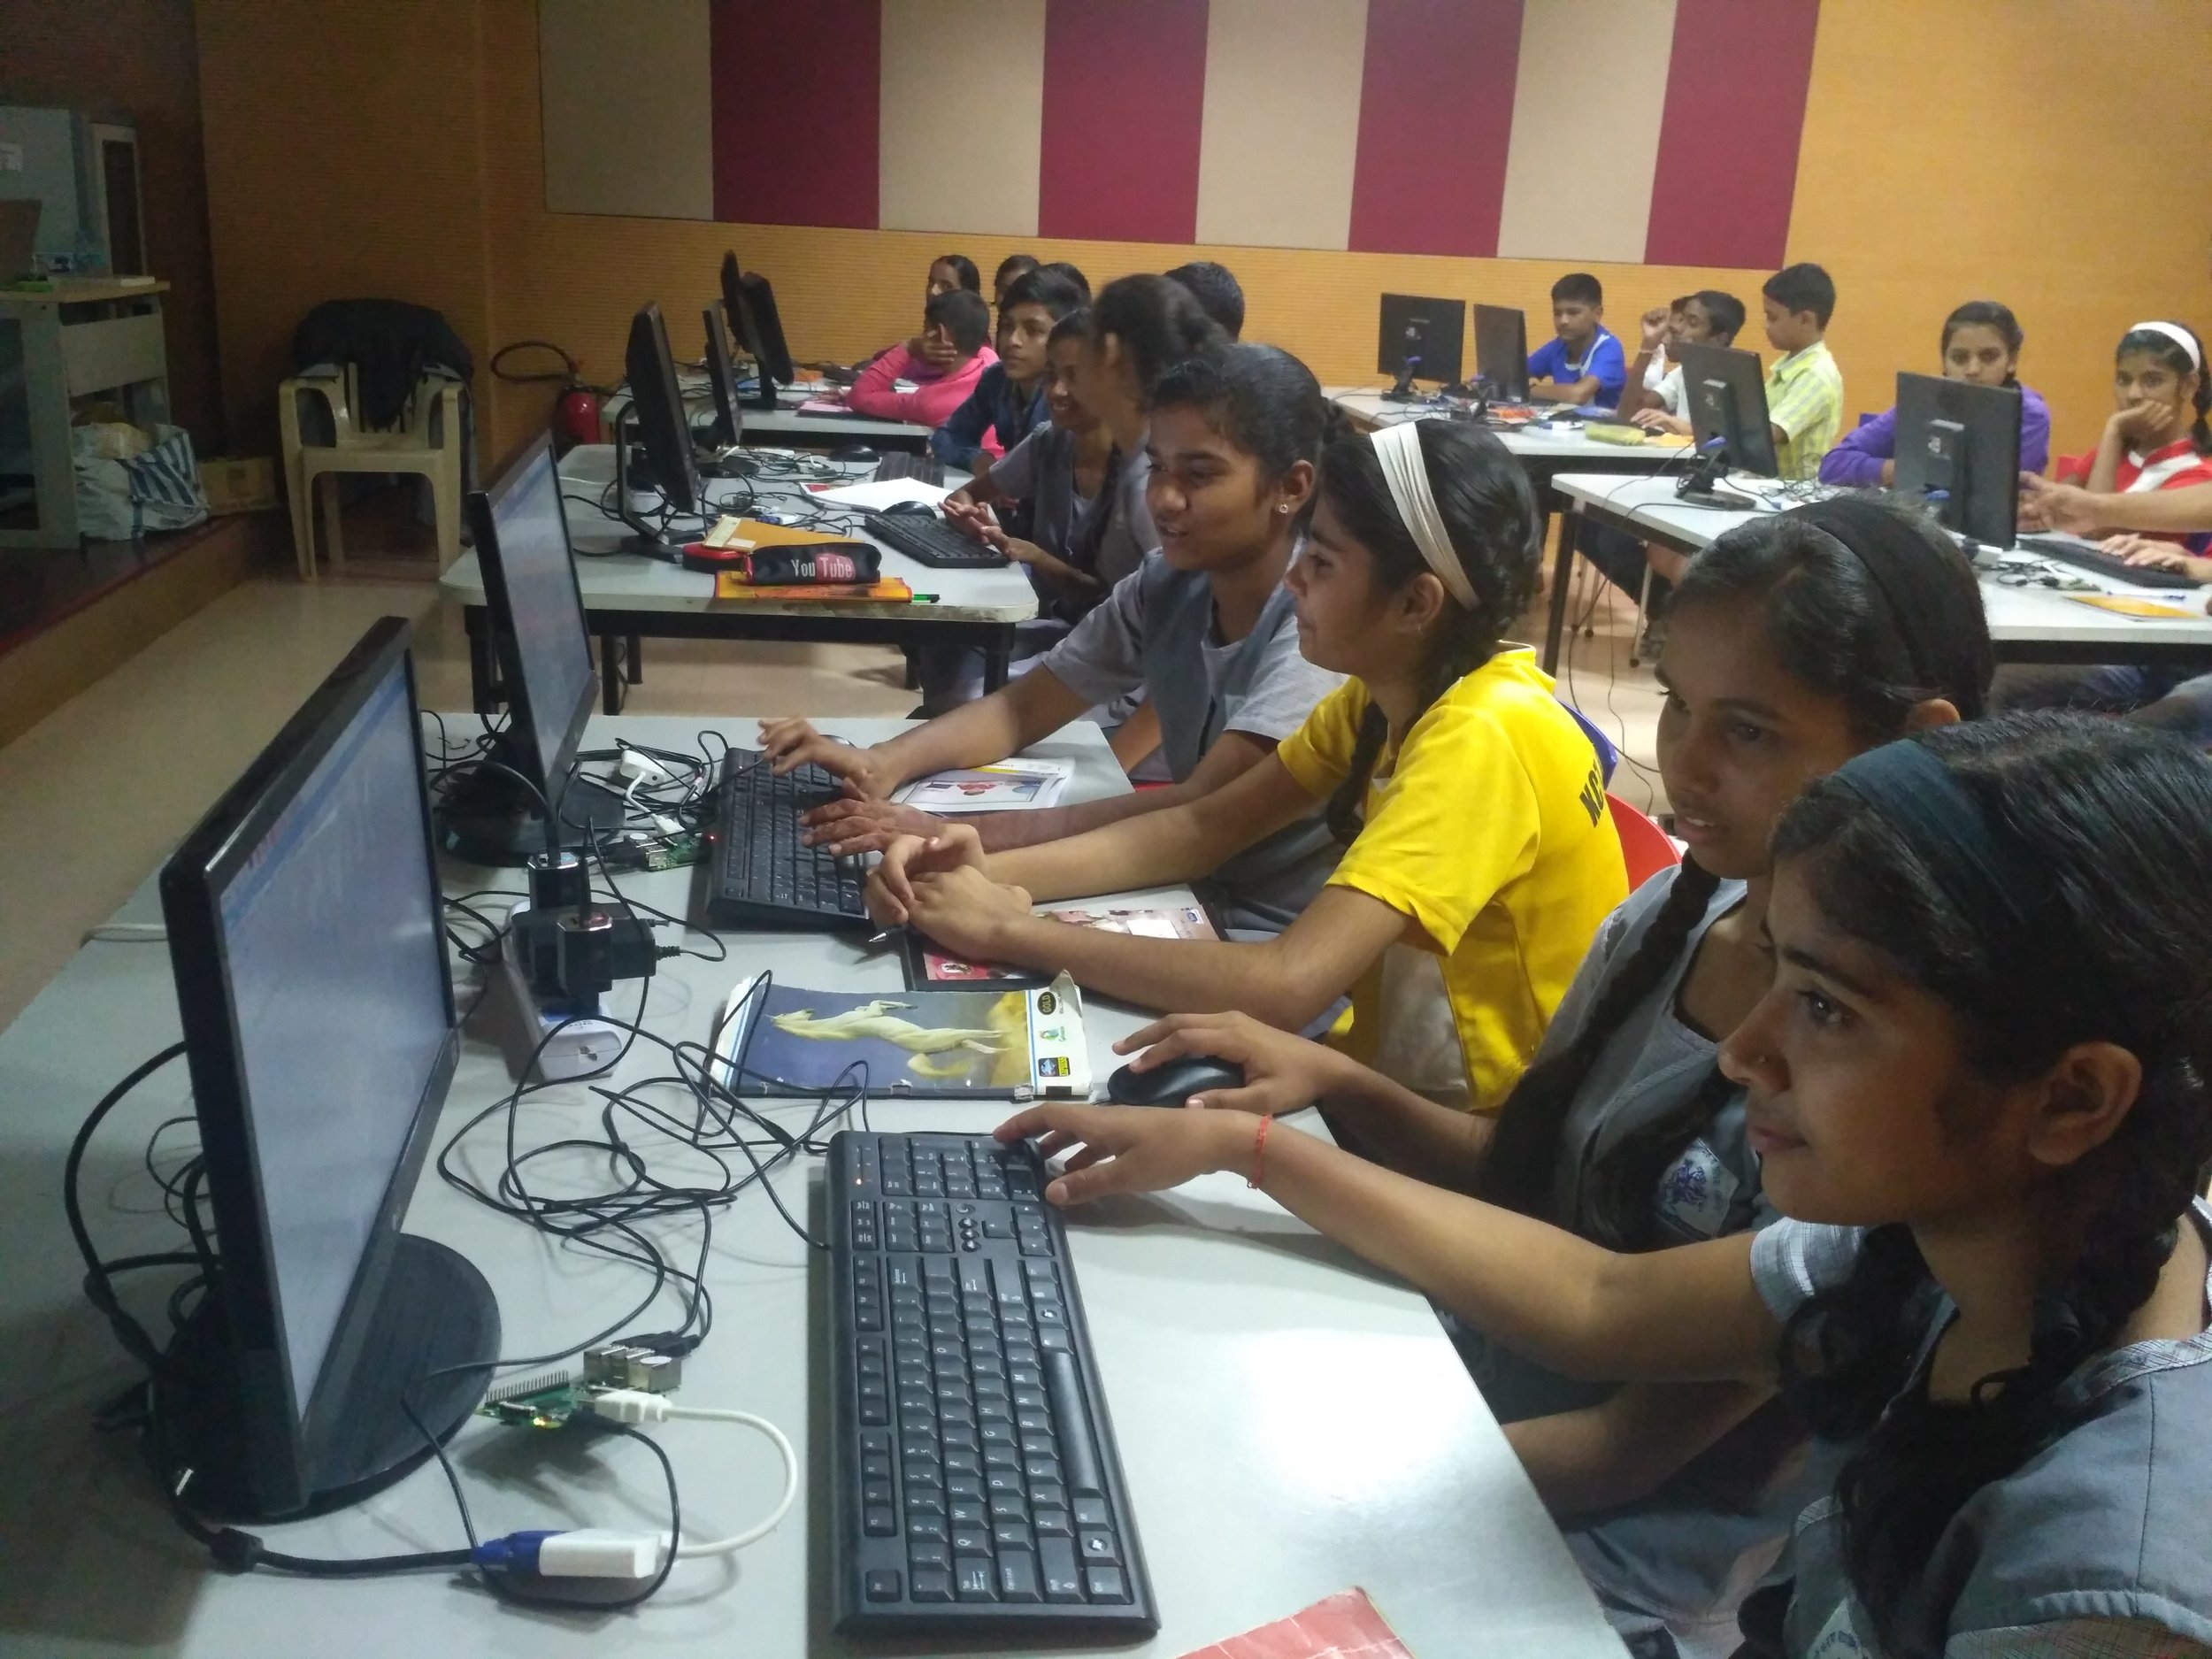
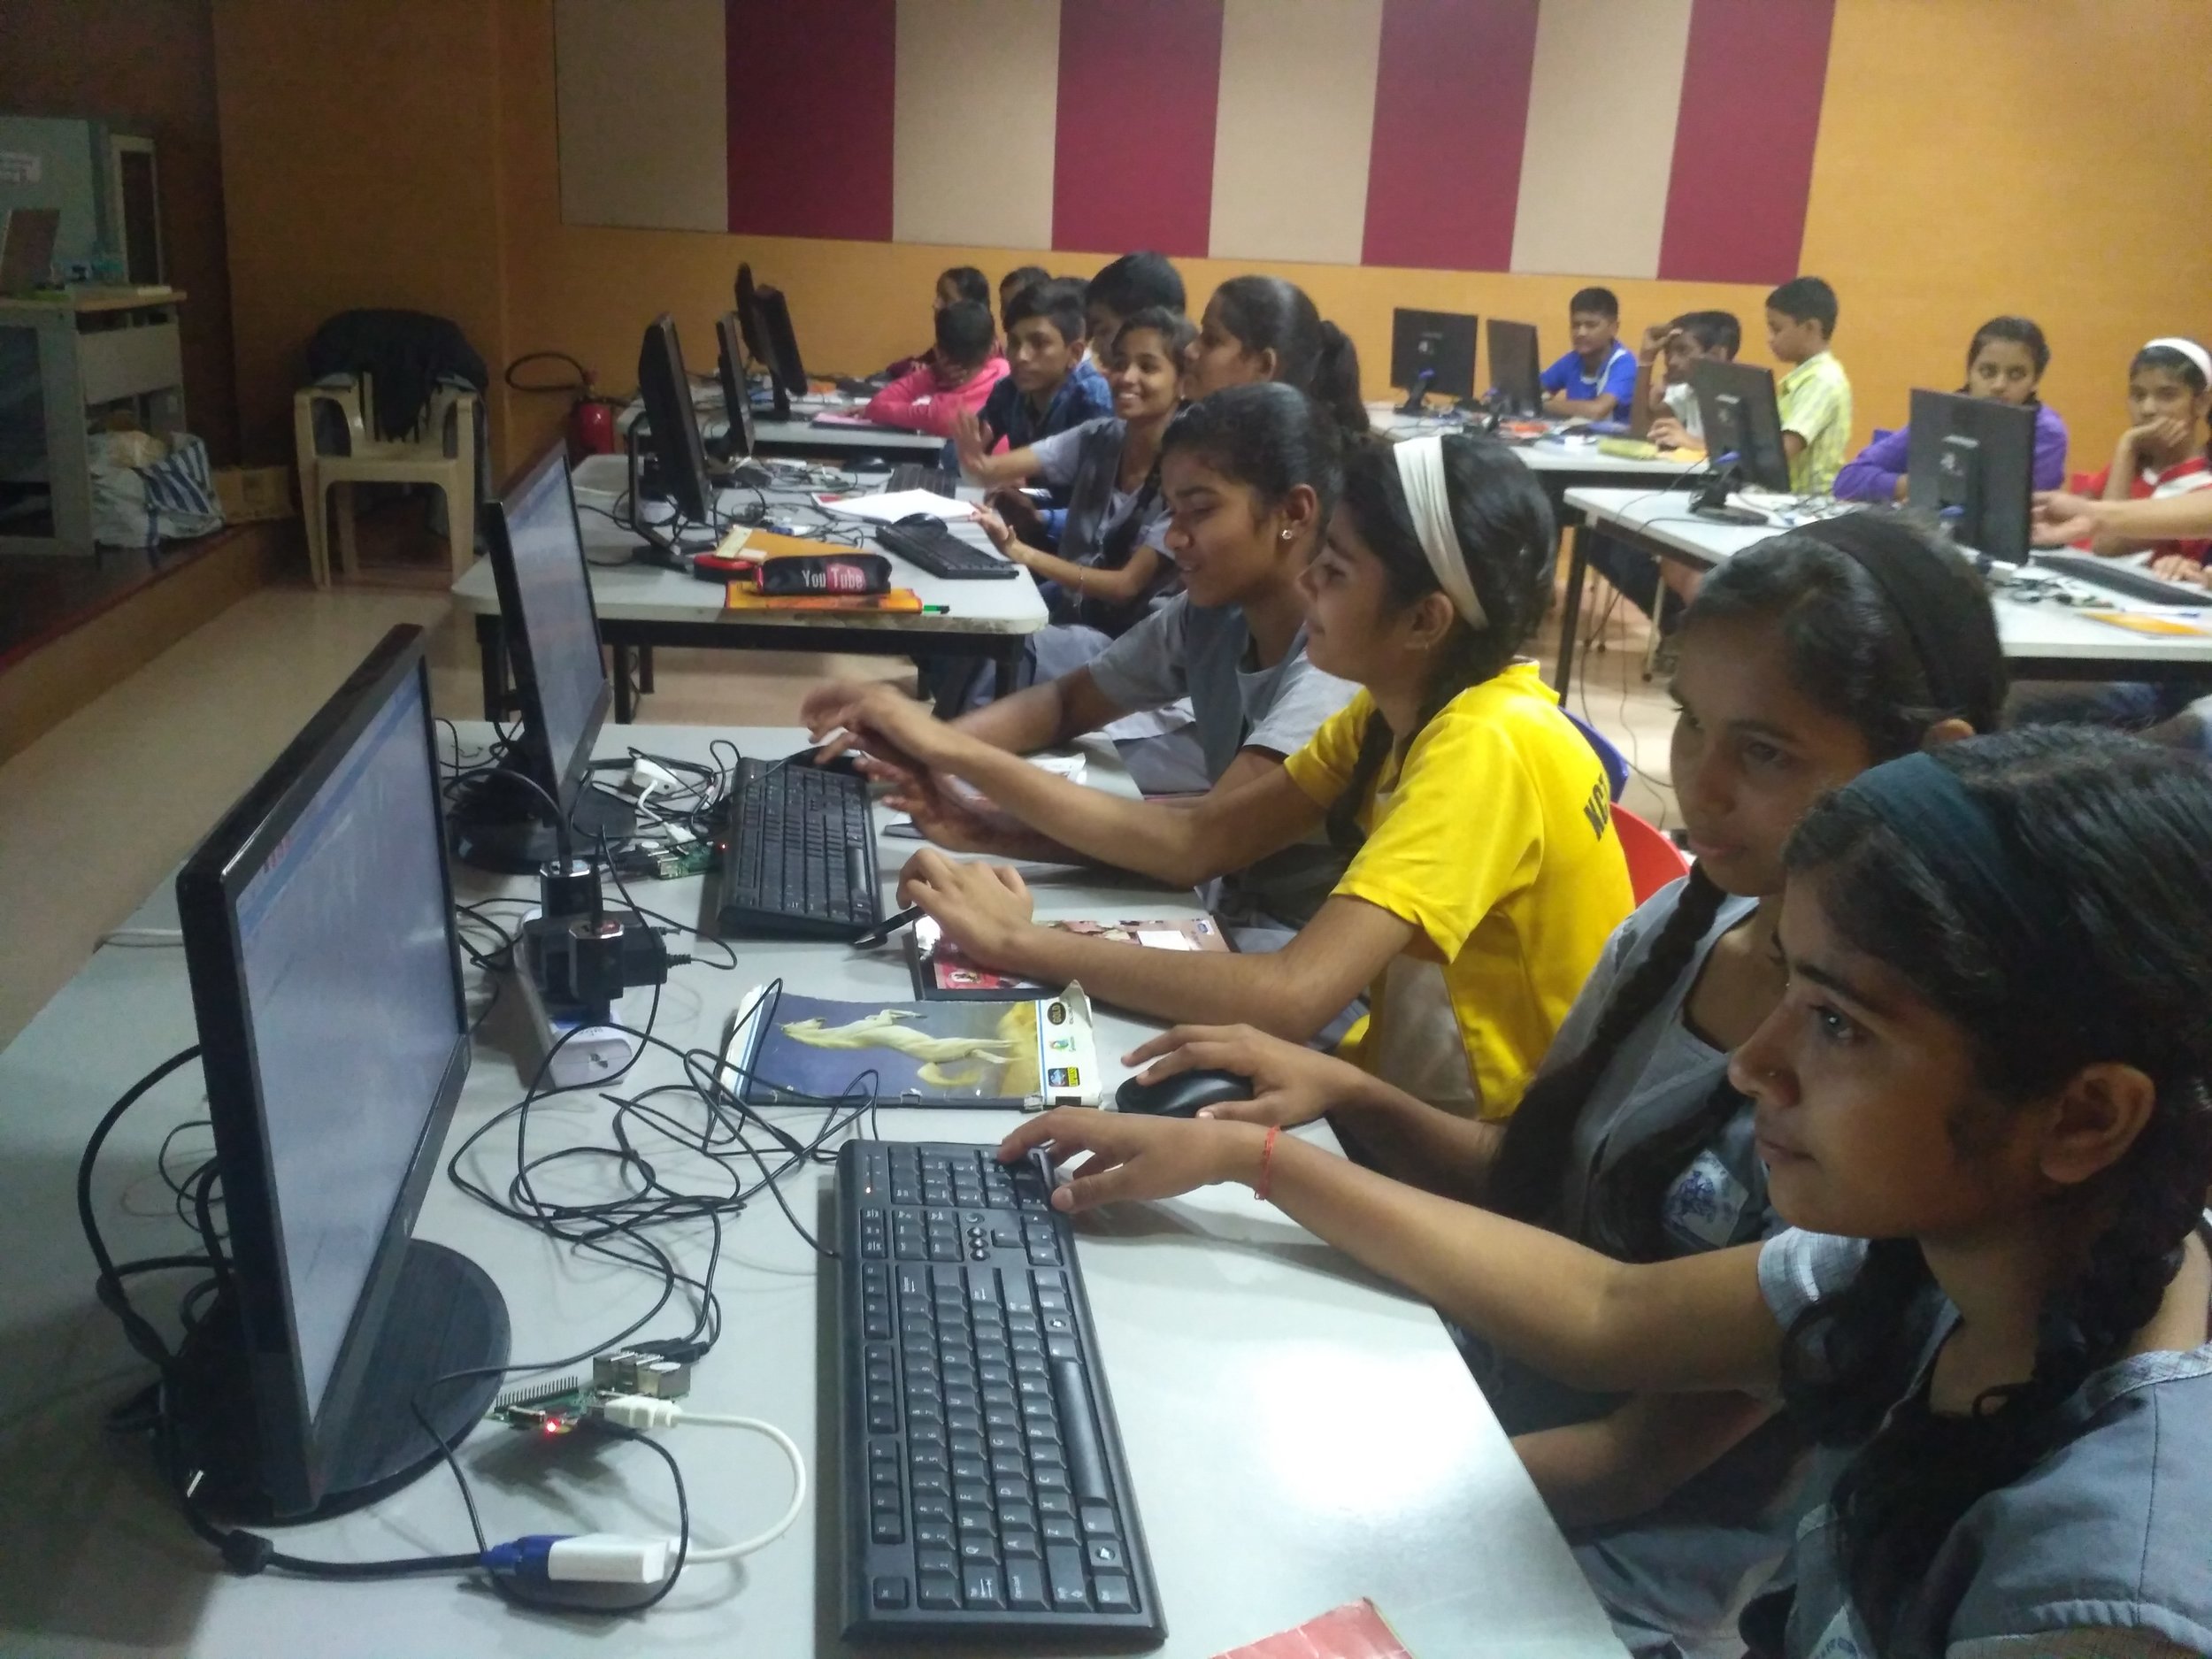
I was carrying my DSLR on Tuesday as I wanted to take some photographs of bacterial samples among other things. I had a half-an-hour break in between so I took the opportunity to shoot a few candid moments while kids were intently listening to Manjushri ma’am during origami session. Here are few of the pics [Note: I was not covering the entire session or trying to frame everyone. If you want to check the official coverage, please check with Sayali at sayali@web.venturecenter.co.in].

You can navigate with arrow keys and click to check the larger version on flickr.

Math Gaming Club 2019

Watch the sky for Perseid Meteor Showers

Lately a lot of rumours have been circulating on a major social networking platforms that we will witness the brightest nights ever recorded in human history on 11 and 12th of August because of the record-break meteor showers. Is there any truth in these news? Let us try to find out more about meteors showers.  

Whenever we see flashy streaks of lights in the sky, we call them meteors [few people even call them “falling stars” or “shooting stars”]. In reality, these meteors are nothing but space rocks left over from the debris of comets or asteroids. And when they are traveling in the space, they are called as meteoroids, few of them fall into the earth atmosphere, then they are called meteors. Most meteoroids that enter into the earth atmosphere [and become meteors] are about the size of a grain of sand. When they enter into the earth atmosphere [with a very high velocity], they get immensely heated because of a friction with air molecules, they start glowing and appear as flashy objects or glowing streaks in the sky. Almost all of the meteors diminish in the air [burn away] before they reach the earth’s surface. Whenever earth passes through a comet’s path, usually hundreds of meteors enter into the earth atmosphere every hour, we call them as meteor shower. 

Now few of the meteor showers happen at the same time every year as our earth passes through the comet’s orbital path. The comets are nothing but major chunks of ice that revolve around the sun in ellipsoid orbits. While revolving when they come near to the sun, intense heat from the sun melts away the comet’s surface releasing gas, dust and rocky particles. This debris released forms a tail along the revolving path of a comet. And when earth passes through these comet’s orbits, the debris falls into earth’s atmosphere resulting into meteor showers.

Now let us try to find out major meteor showers the earth experiences every year. Mathematica has a nice data repository about astronomy. We can pull the data for the time intervals of the major meteor showers that happen every year. [You can try these commands on a free version of Mathematica that comes with every Raspberry Pi.]

peakTime=MeteorShowerData[All,{“Name”,"ActivityPeriod"}]/.{x_,y_}:>Association@{x->y};
TimelinePlot[peakTime,PlotStyle->97,Filling->Below,ImageSize->{1000,2500},AspectRatio->2.5,PlotLayout->"Vertical",Spacings->Range[10,30],BaseStyle->Directive[FontFamily->"Gill Sans",13],PlotTheme->{"Business"}]

Figure 1. Timeline plot for the major meteor showers that happen each year. The vertical left axis is the months and vertical lines with filled colors are the time intervals for every meteor shower along with their names.

As we can see from the Figure 1, meteor showers happen round the year. The International Astronomical Union's Task Group decides the names for these meteor showers and the names are usually given after the nearest constellation or bright star.

We can also find out the peak frequency and the peak time of these meteors:

peakHour = DeleteMissing[MeteorShowerData[All,{"PeakDate","PeakZHR","Name"}],1,1]/.{x_,y_,z_}->{{x,y} -> z};

Figure 2. A plot of peak time of meteor showers and their peak frequencies. Meteors with larger frequency are labeled for the sake legibility.

Now we are in the month of August and we can clearly see from the above two figures that there are a few meteor showers this month. Among these, Perseid meteor showers are one of the brightest showers of the year. They usually occur every year between July 17 and August 24. And they really create spectacular displays of fireballs that light up the night. We can see the peak frequency and peak date for the Perseid showers from the Figure 2. We can alternatively find out directly:

MeteorShowerData[Entity["MeteorShower", "Perseids"], {"PeakDate", “PeakZHR"}]
= Date -> 2017/8/12, PeakZHR -> 100 /h   

So the peak time for the Perseid meteor shower is 12th of August and one can see 60 to 100 meteors in an hour if the sky view is clear. We can also find the velocity with which they enter into the Earth’s atmosphere:

MeteorShowerData[Entity["MeteorShower", “Perseids"], “GeocentricVelocity"]
= 59.0 km/s

That’s really enormous speed. With that you can travel from Mumbai to Delhi in almost 20 seconds.

GeoDistance[Entity[“City",{"Bombay","Maharashtra","India"}],Entity["City",{"Delhi","Delhi","India"}]]
= 1164.44 km
= 1164.44 km/ 59 km/s = 19.7363 s
  

The name Perseid has been given because of its origin from the constellation called Perseus. It is somewhere in the northeast around midnight. We can visualize this constellation:

ConstellationData[Entity["Constellation", "Perseus"], "ConstellationGraphic"]  

Figure 3. Perseus constellation from which Perseid meteor showers originate.

The name Perseus has its origin in Greek mythology. He was the legendary founder of Mycenae and of the Perseid dynasty of Danaans. We can query more information about him as Mathematica has full data about Mythology:

Entity["Mythology", “Perseus”]["Image"]

Figure 4. Perseus with the Head of Medusa

Now the important question why these Perseid meteor shower happen in August every year? This is because every year our earth passes through the comet’s orbit around this time. We can find the name and other information of this comet:

MeteorShowerData[Entity["MeteorShower", “Perseids"],”ParentObject"]
= Comet -> 109PSwiftTuttle

The comet is Swift-Tuttle and it revolves around the Sun in an ellipsoid orbit. It takes 133 years to complete one round around the Sun. We can pull the data for its orbital path and helio coordinates to visualise its way around the Sun:

swiftTuttle=CometData[109P/Swift-Tuttle (comet),{“OrbitPath”,"HelioCoordinates"}];
Graphics3D[{Orange,Sphere[{0,0,0},0.5],Text[Style[“Sun",14],{0,0,0}-{1.5,0,0.5}],swiftTuttle[[1]],Yellow,Sphere[QuantityMagnitude@swiftTuttle[[2]],0.35],Text[Style["Swift-Tuttle",14],QuantityMagnitude@swiftTuttle[[2]]-{0,-.5,1.9}]},Boxed->False,Background->Black,ViewAngle->Pi/12,ImageSize->600]

Figure 5. Comet Swift-Tuttle and its orbital path around the Sun. Earth crosse the orbital path of this comet every year around August.

The Swift-Tuttle comet when passes close to the Sun, part of it gets melted away releasing ice, dust and other particles which forms the tail along its orbital path [the debris is also formed because of collisions with other celestial stuff]. When the Earth passes through this orbit, the meteoroids floating in this orbit enter into the Earth’s atmosphere with glowing streaks because the air molecules in the atmosphere. We can easily visualise the peak time for this meteor shower to find out the best days to watch in the sky:

comet = Table[
  With[{date = DateObject[{2017, 7, 15 + t}]}, 
   EntityValue[
    Entity["Comet", "Comet109PSwiftTuttle"], {"OrbitPath", 
     EntityProperty["Comet", 
      "HelioCoordinates", {"Date" -> date}]}]], {t, 0, 60, 0.5}];
earthHelio = 
 Table[With[{date = DateObject[{2017, 7, 15 + t}]}, 
   EntityValue[Entity["Planet", "Earth"], 
    EntityProperty["Planet", 
     "HelioCoordinates", {"Date" -> date}]]], {t, 0, 60, 0.5}];

pathEarth = Entity[“Planet”, ”Earth”], [“OrbitPath”];
dates = Table[DateString[{2017,7,12+t},{"MonthName"," “,”Day"}],{t,0,60,0.5}];
datesPath = Transpose[{earthHelio,dates}];

Graphics3D[{Orange,Sphere[{0,0,0},0.25],Text[Style["Sun",White,FontFamily->"Helvetica Neue LT Std",14],{0,0,0}],Yellow,comet[[1,1]]/.Line->Tube,Text[Style["Comet Orbit",FontFamily->"Helvetica Neue LT Std",14],{0.05,1.6,0.85}],Green,pathEarth,Sphere[QuantityMagnitude[#[[1]]],0.05],Text[Style["Earth",FontFamily->"Helvetica Neue LT Std",14],QuantityMagnitude[#[[1]]]+{0.25,-0.5,0.25}],Text[Style[#[[2]],FontFamily->"Helvetica Neue LT Std”,30,Bold,White],{-1.5,0.5,1.35}]},Background->Black,Boxed->False,PlotRange->4,ViewAngle->Pi/20,ImageSize->600]&/@datesPath;

It may take a while to load the following animation if you are on slow internet connection.

Figure 6. Earth passes through the orbital path of comet Swift-Tuttle around 11- 12th August. It is the peak period for Perseid meteor showers.

Now where can I see this spectacular show of Perseid meteor showers? People in the northern hemisphere places should be able to see it. I stay in Pune, India. I can quickly check for my place:

GeoGraphics[{GeoHemisphere[], GeoMarker[]}]

Figure 7. Northern hemisphere portion of the Earth [dark colored] with a geomarmer at Pune.

India is in both eastern and northern hemispheres. Since the radiant point of Perseid meteor shower is in the Perseus constellation, one can look between the north-eastern part of the sky and the zenith [the point in the sky directly above you]. You can use the compass app in your mobile device for finding the north-eastern direction in the sky. 

The best time to view the Perseids is between midnight and dawn [i.e. usually between 1 am to 5 am]. Other factors that may affect the visibility of showers is the cloud coverage and moon phase. The light coming from the moon may hinder the spectacular view of showers depending on the phase. So let’s check for the moon phases for the active days of Perseids: 

Grid[Partition[Table[With[{date=DateObject[{2017,8,8+t}]},Column[{Style[DateString[date,{"MonthName"," ","Day"}],White,FontFamily->"Helvetica Neue LT Std”,12],Column[MoonPhase[date,#]&/@{"Icon","Name"},Center]},Center]],{t,0,5}],3],Background->GrayLevel[0.2],Spacings->{2,2}]

Figure 8. Phases of the moon from August 8 to August 14. The light of a bright waning gibbous moon on 11 and 12th August may hinder the shower view.

Unfortunately we have to deal with the waning gibbous phase [gibbous is nothing but having the illuminating part larger than a semicircle and less than a circle] of the moon. The bright light from the moon may hinder the Perseid show. Find out an area with moon-shadow [a plateau area with high-rise mountain, hill, building or even a large tree to block out the moon] and make sure you are far away from the glow of city lights to have a clear view.

Now let’s check for the cloud coverage which can affect our visibility. We can pull the data from Wolfram|Alpha for my location- Pune: 

clouDataPune=WolframAlpha["Cloud cover in Pune”,{{“CloudCoverChart:WeatherData",1},"TimeSeriesData"}];
cloudCoverage = Cases[clouDataPune[[1]],{x_,y_}:>{x,Interpreter["HeuristicPercent"][ToString@y]}];
predictedClouds = Cases[clouDataPune[[2]],{x_,y_}:>{x,Interpreter[“HeuristicPercent"][ToString@y]}];
ticks = Quantity[Range[0, 100, 10], “Percent”];
DateListPlot[cloudCoverage, 
 FrameTicks -> {{ticks, None}, {Automatic, None}}, Mesh -> Full, 
 PlotTheme -> "Detailed", AspectRatio -> 1/4.5, ImageSize -> 900, 
 FrameLabel -> {"Time", "Cloud Coverage"}, Filling -> Bottom, 
 BaseStyle -> Directive[FontFamily -> "Gill Sans", 12]]

Figure 9. Cloud coverage in Pune city. The dark clouds will mask the shower show.

We can check for predictions for further dates:

DateListPlot[predictedClouds,FrameTicks->{{ticks,None},{Automatic,None}},PlotRange->All,Mesh->Full,PlotTheme->{"Detailed"},AspectRatio->1/4.5,ImageSize->900,FrameLabel->{"Time","Cloud Coverage"},Filling->Bottom,BaseStyle->Directive[FontFamily->"Gill Sans”,12]]

Figure 10. Predicted cloud coverage in Pune city for the next week.

It seems that our view [at my place] will be masked by the dark clouds as well. 

And lastly it’s time to debunk the rumour of brightest night on 11 and 12th of August. The Perseid shower of this year will not be significantly different than that of past years. There are no predictions for an extraordinarily spectacular show of Perseid shower for the year 2017. Predicting the outbursts is more of an art than a science. So all the rumours about brightest nights ever or “once in a life time” are nothing but the things blown out of proportion.

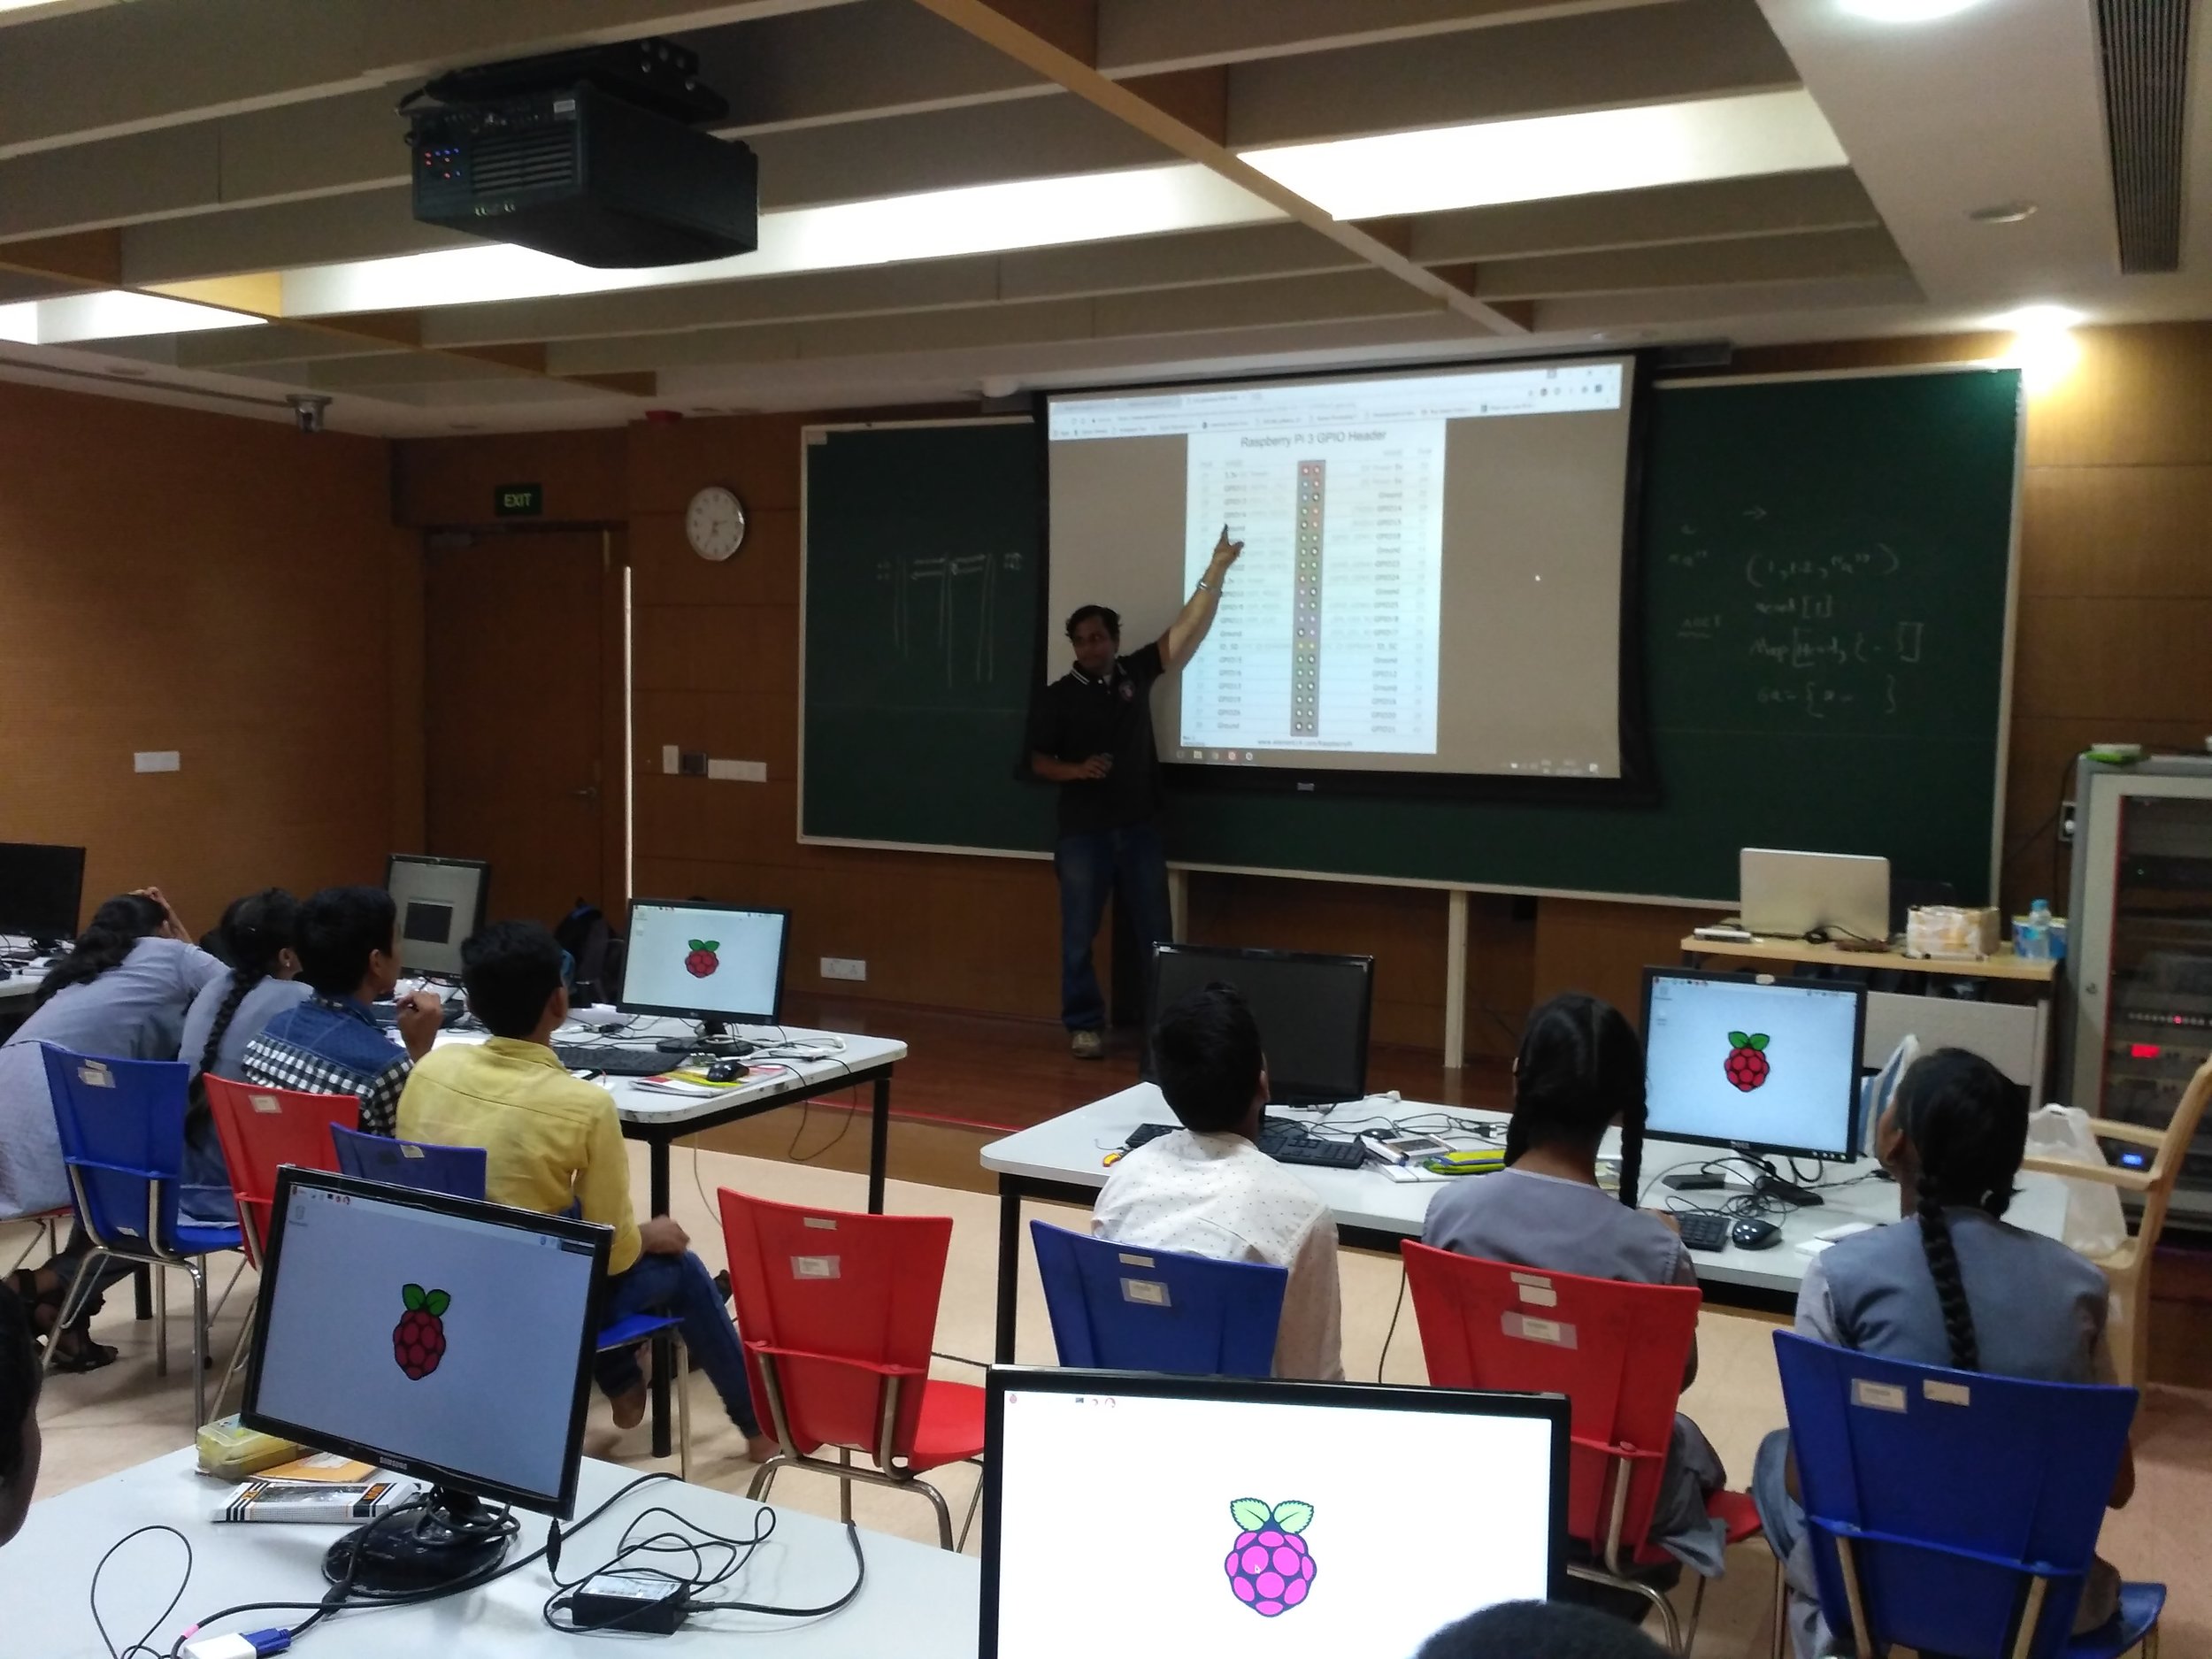
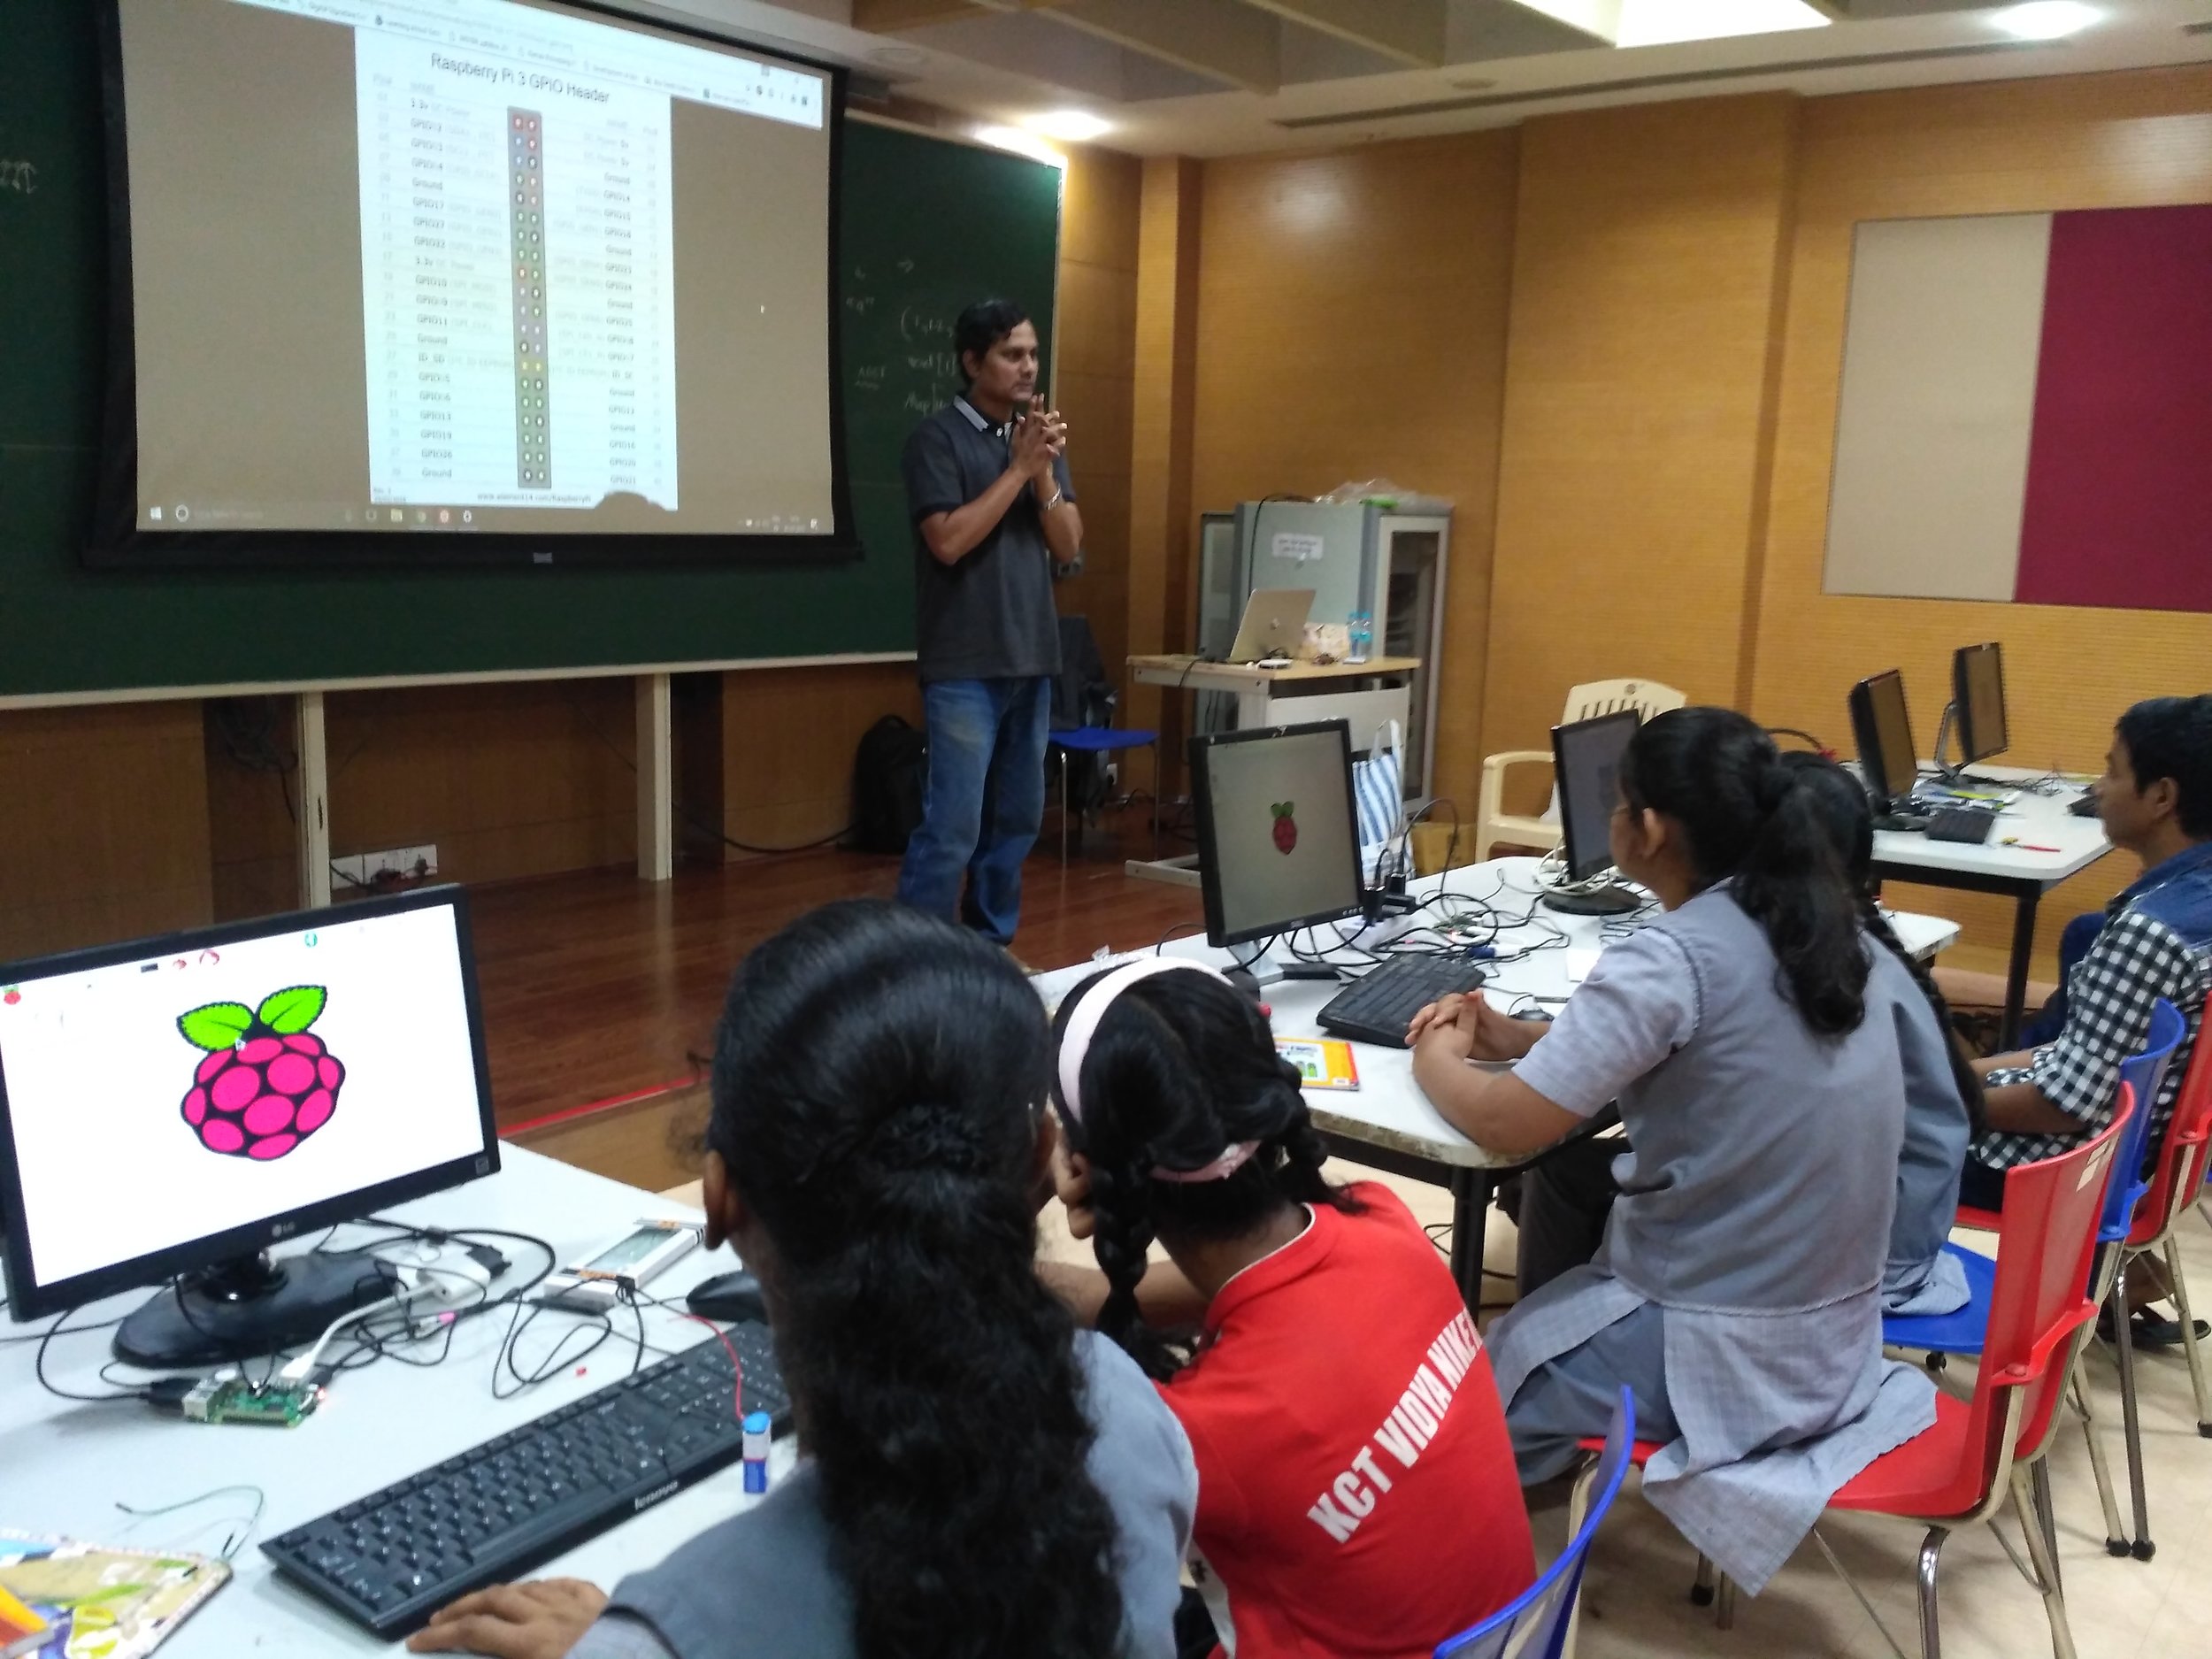
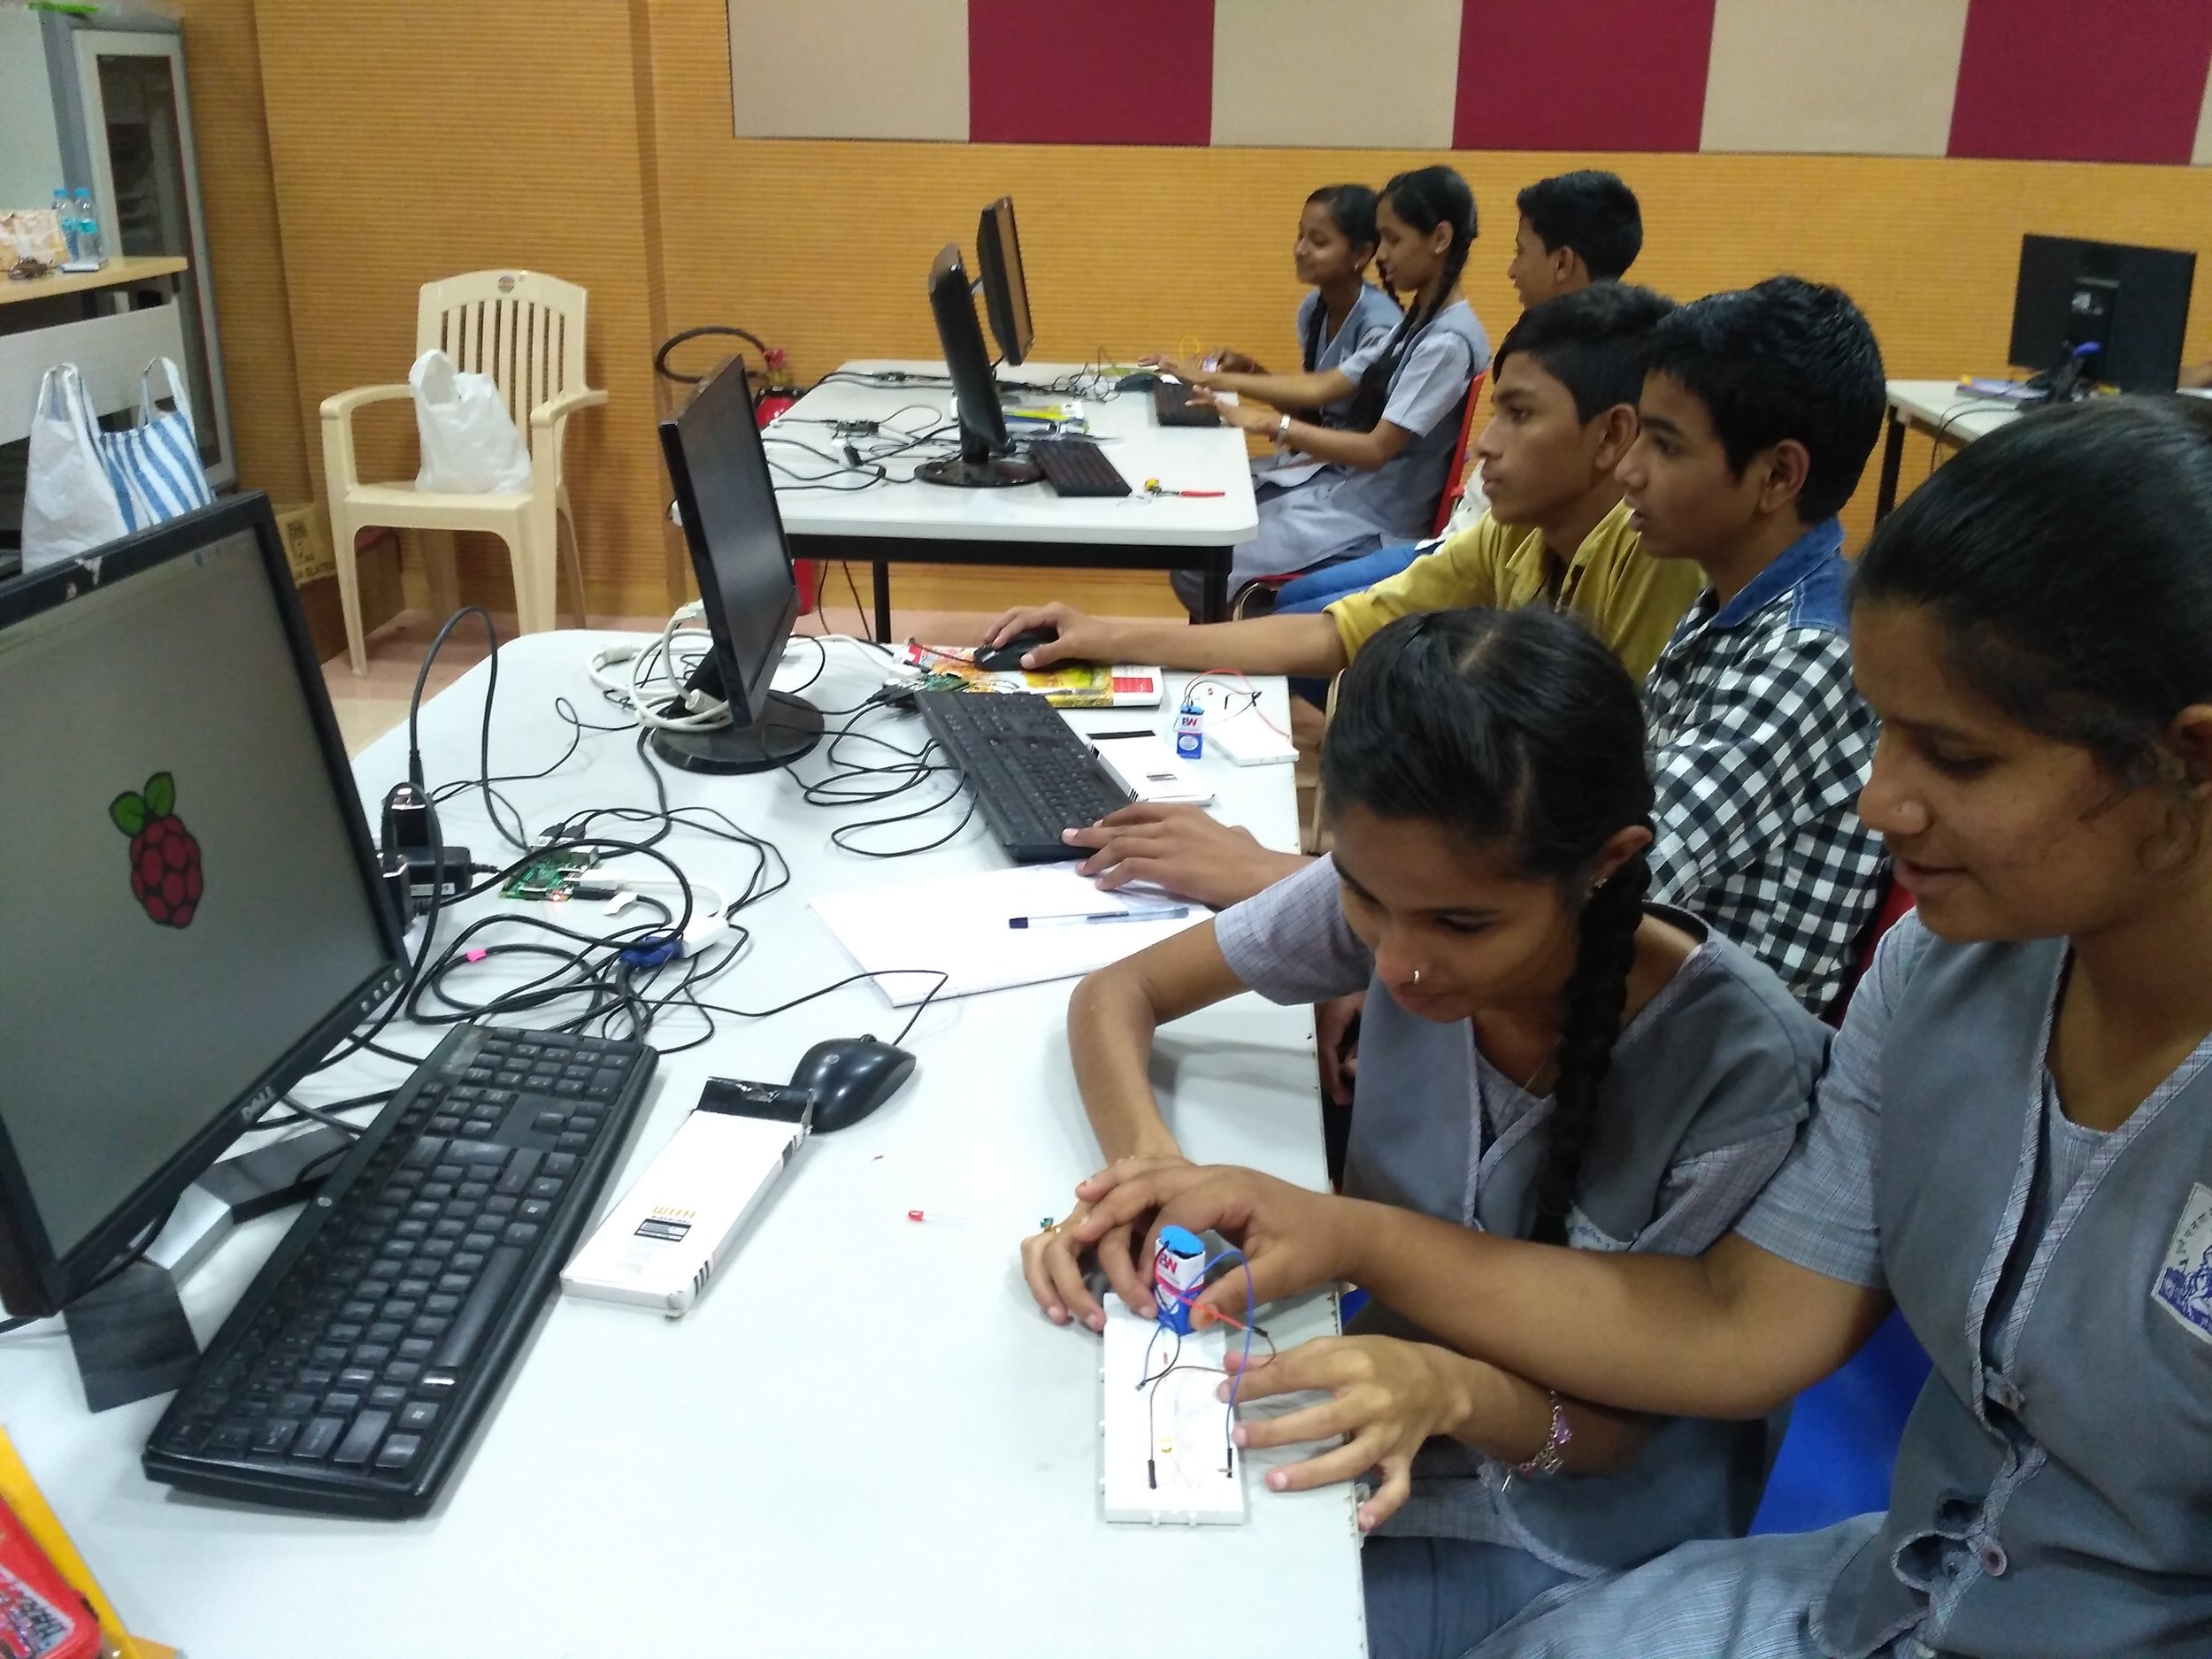
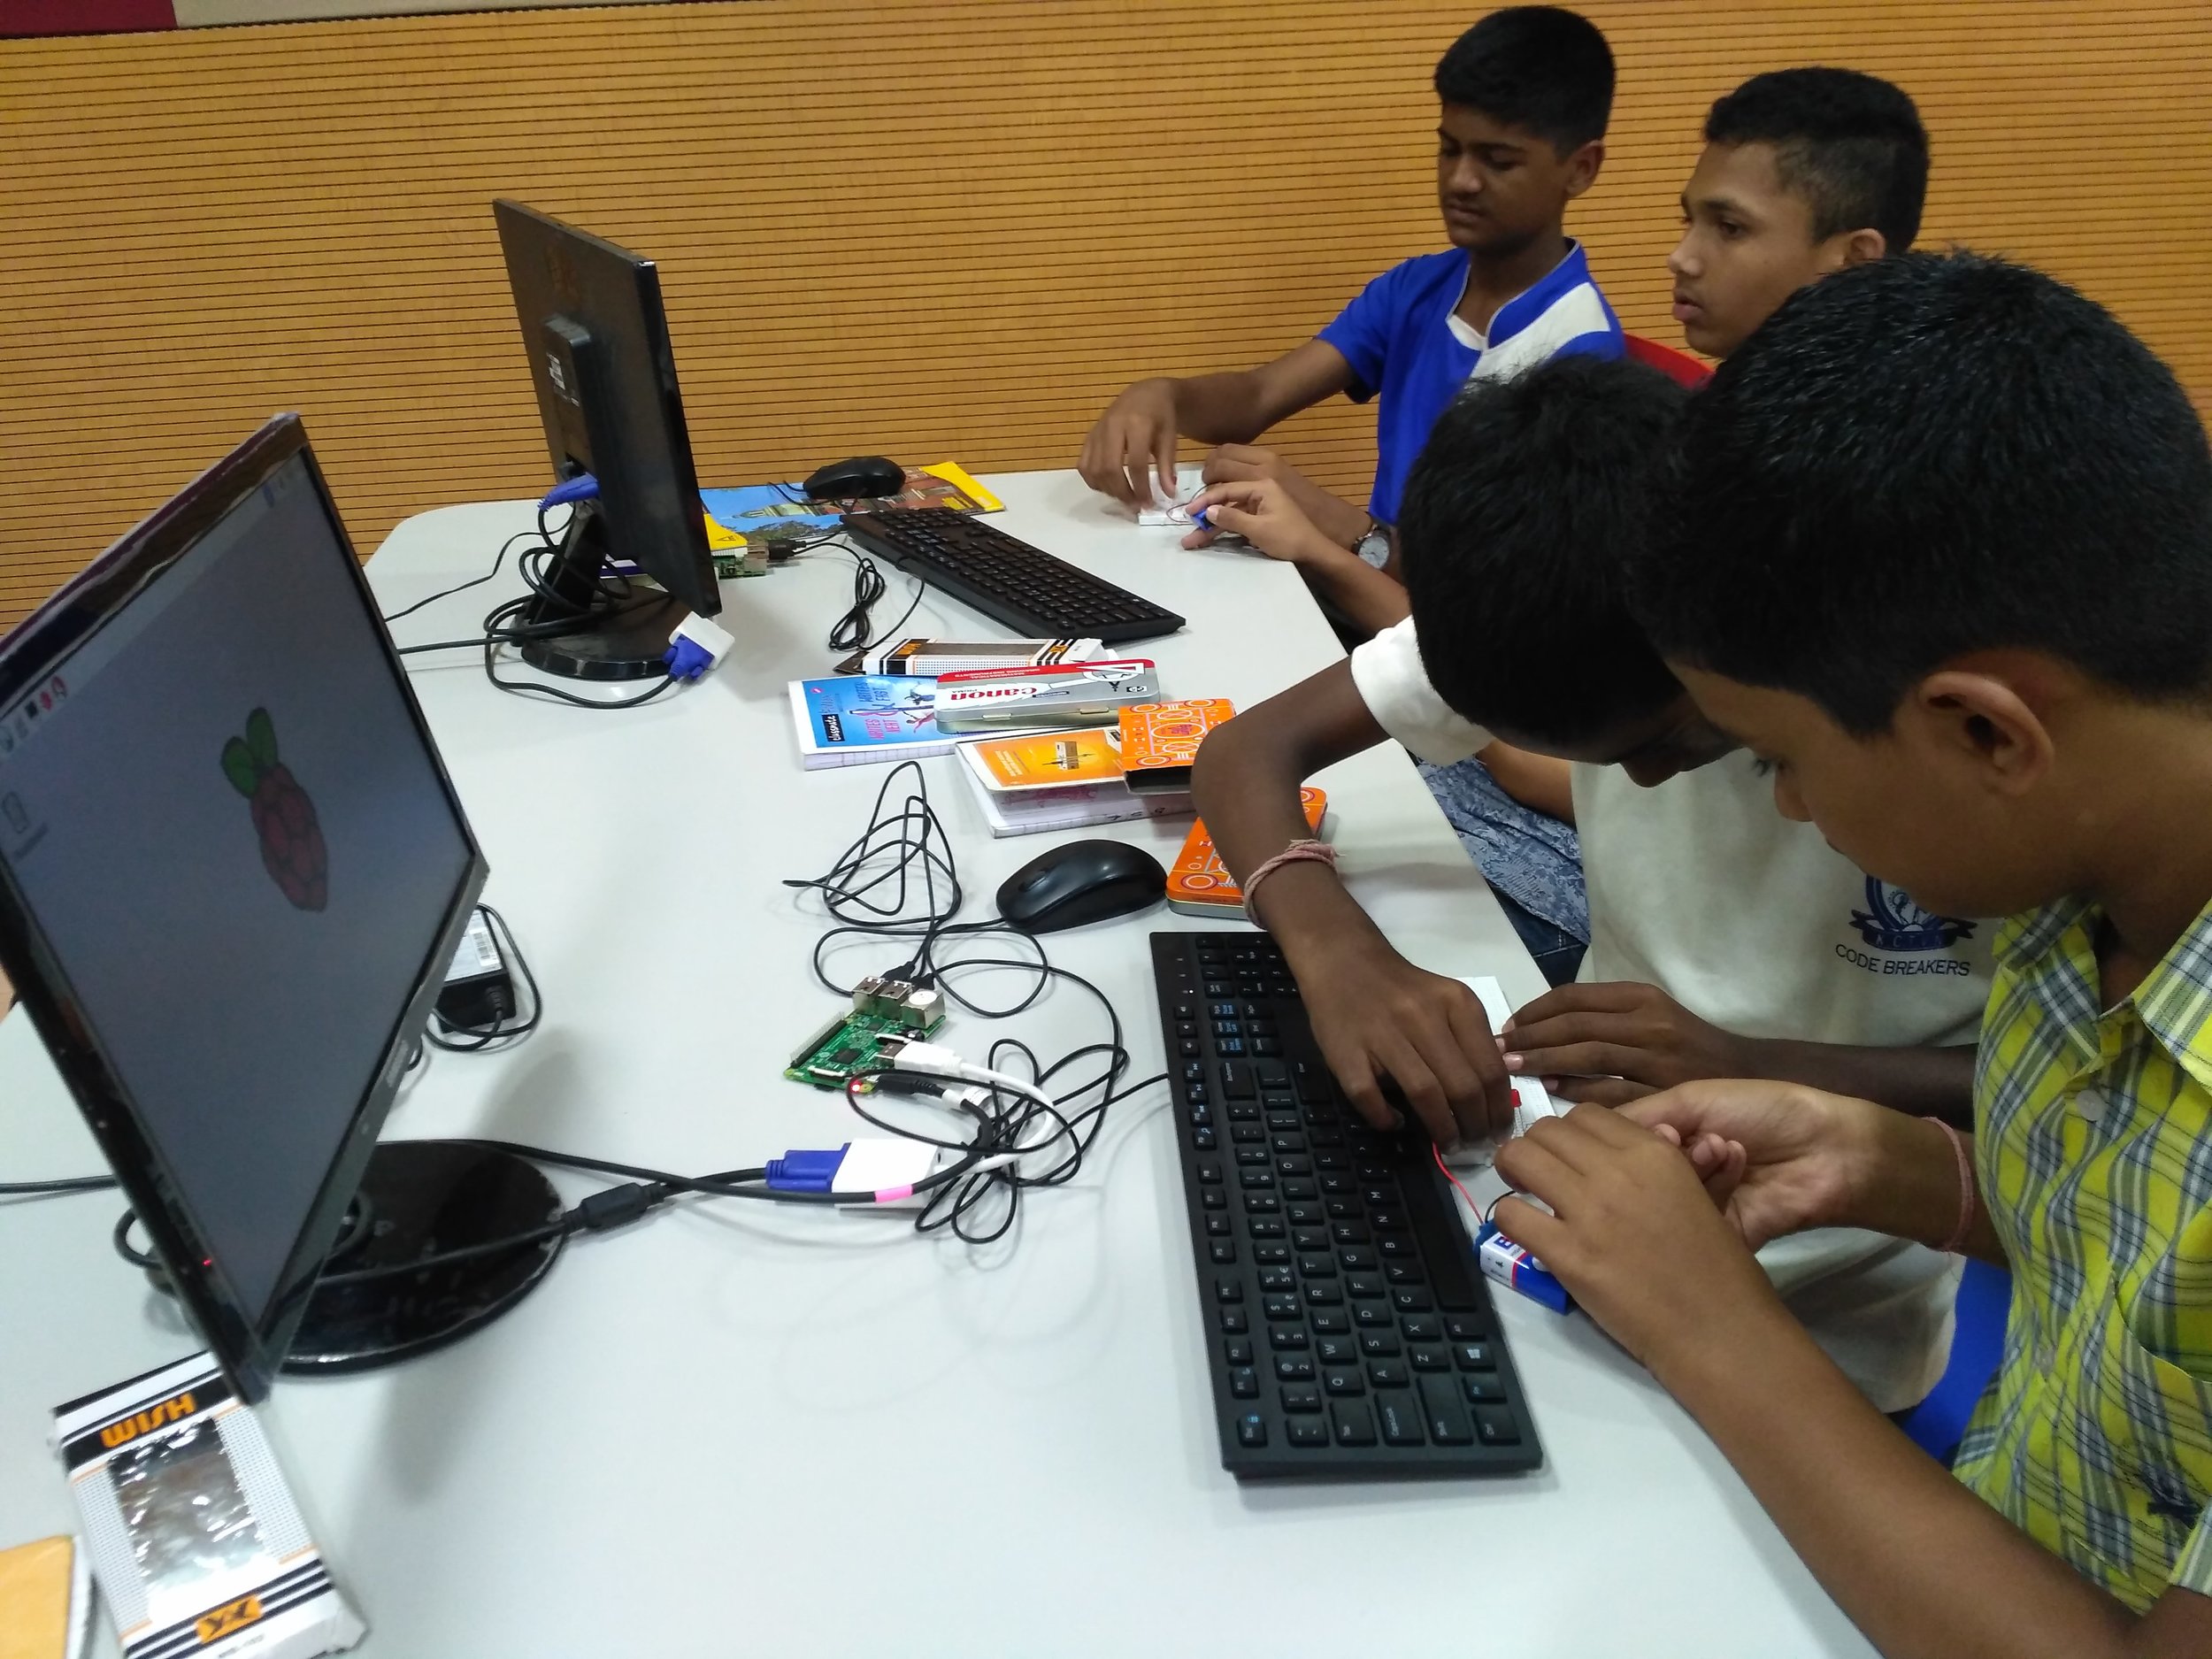
Few pics from Raspberry Pi workshop at IISER, Pune

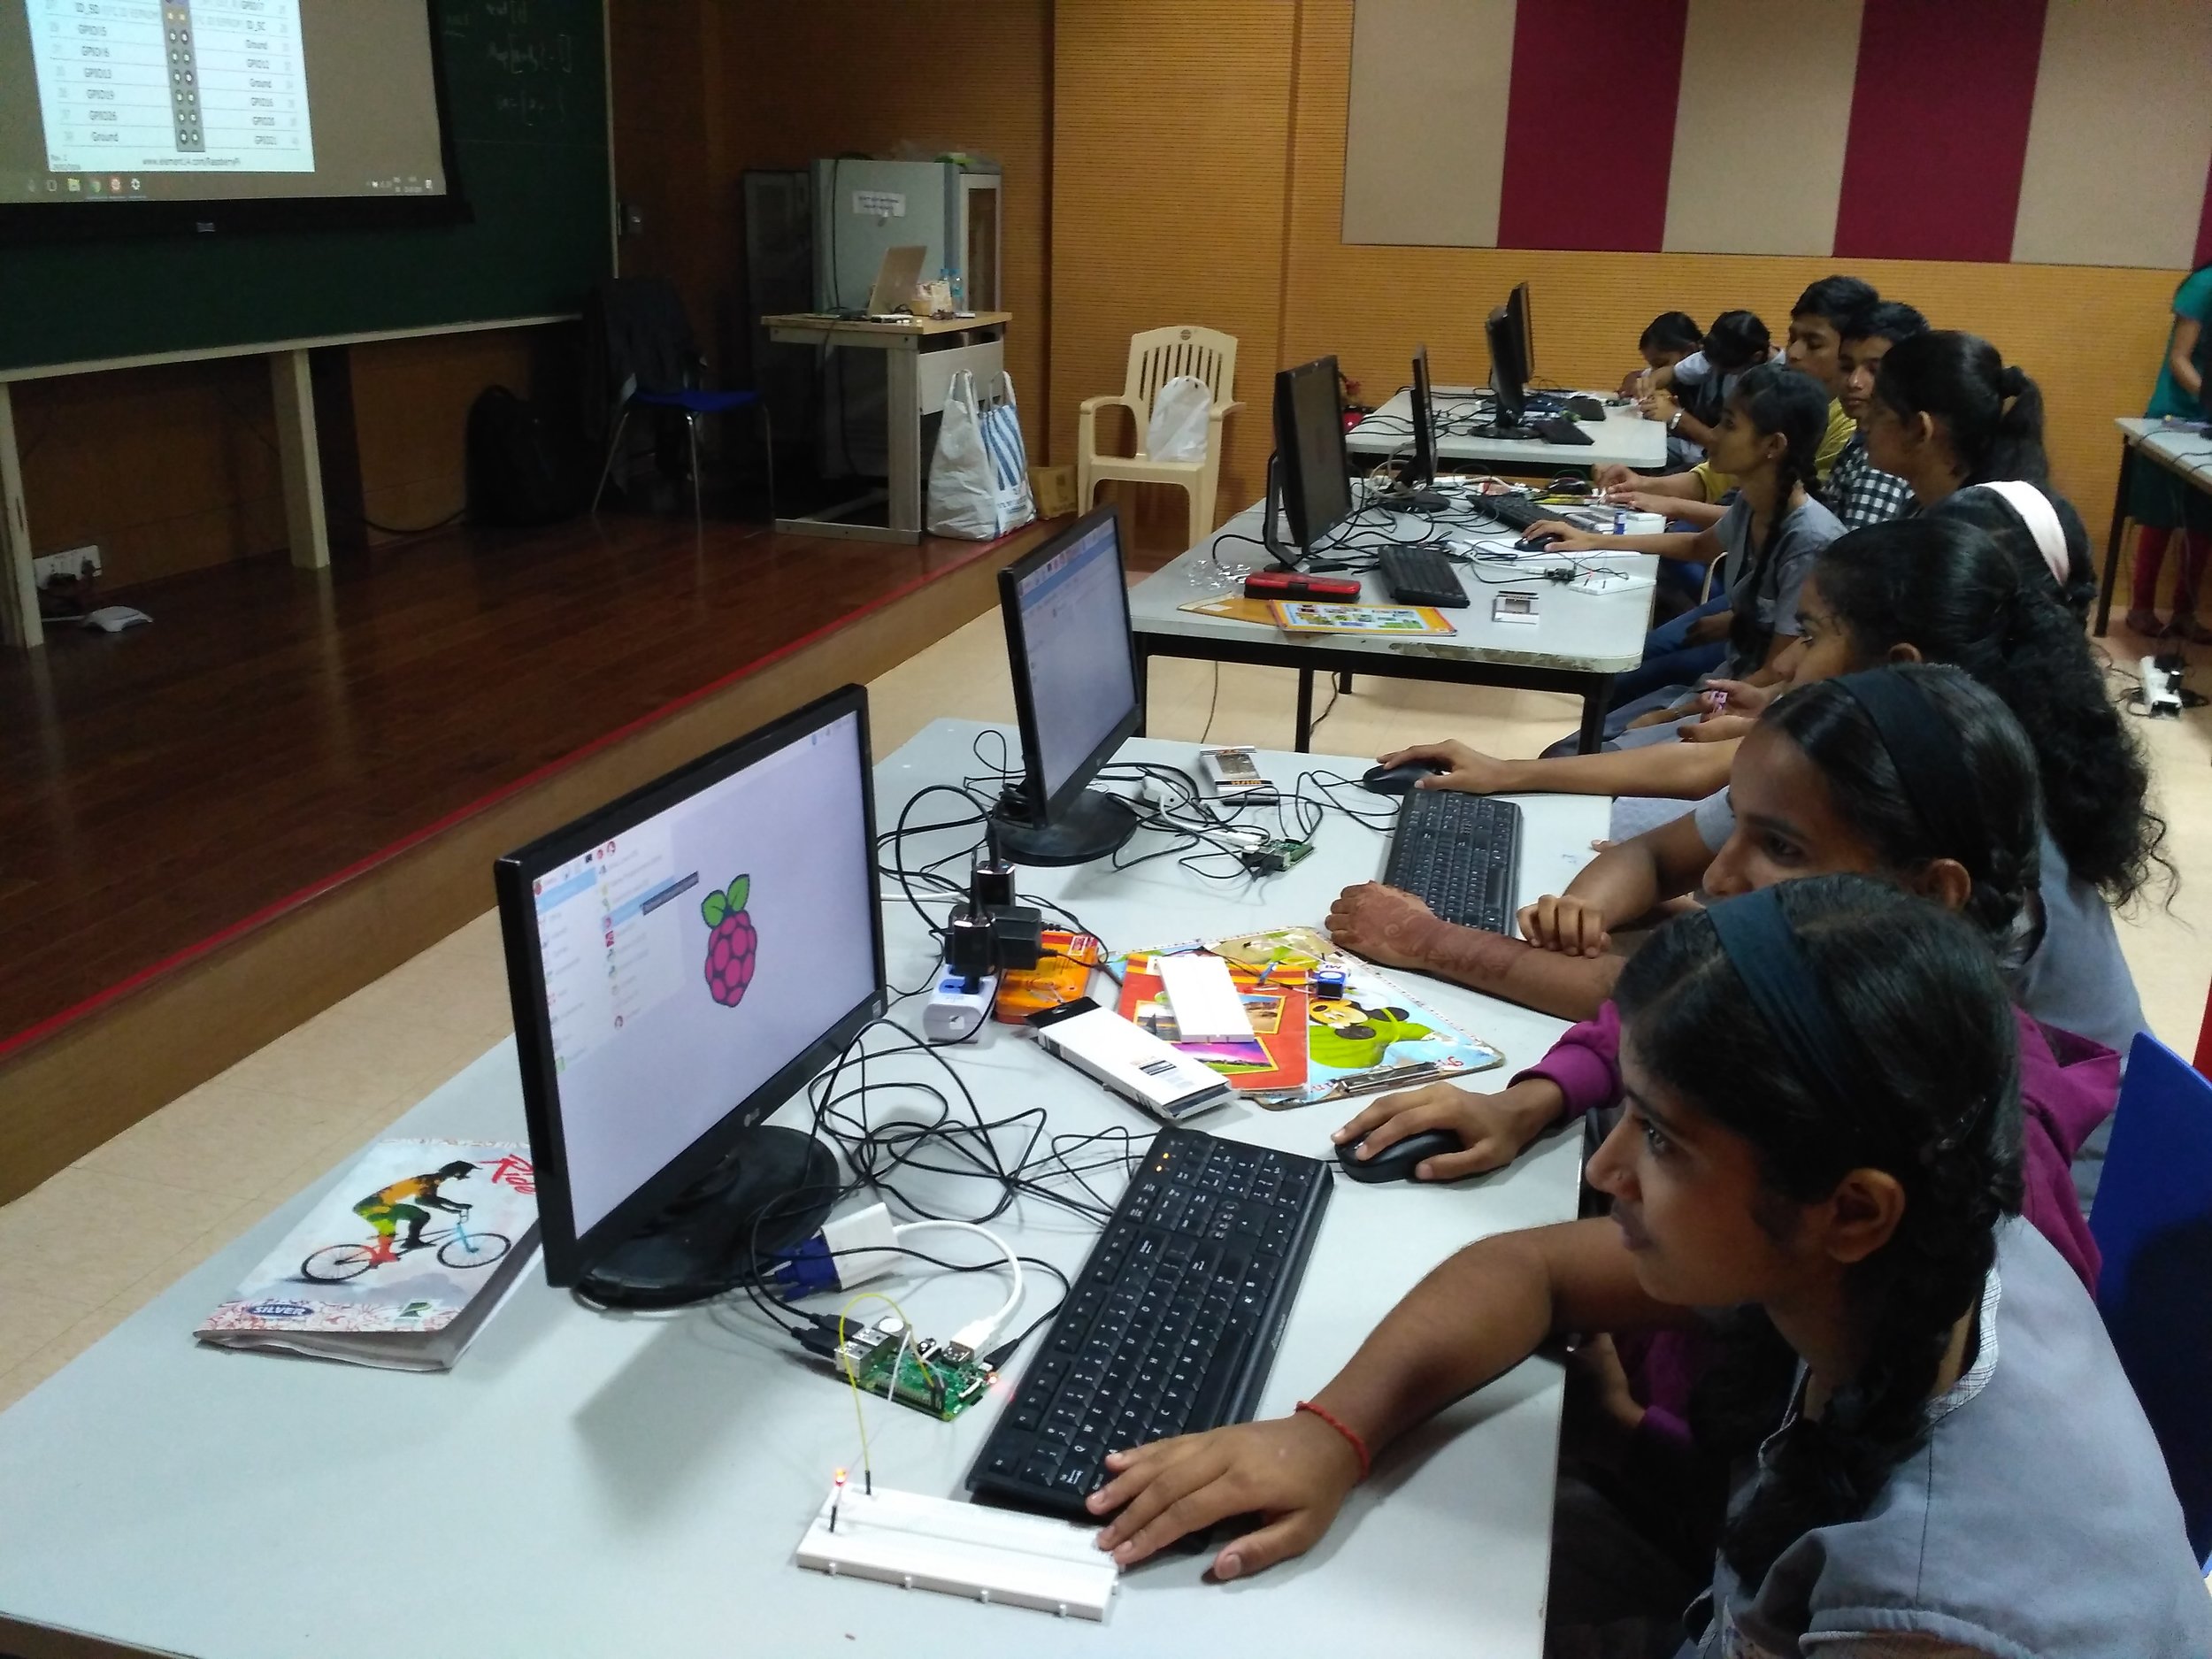
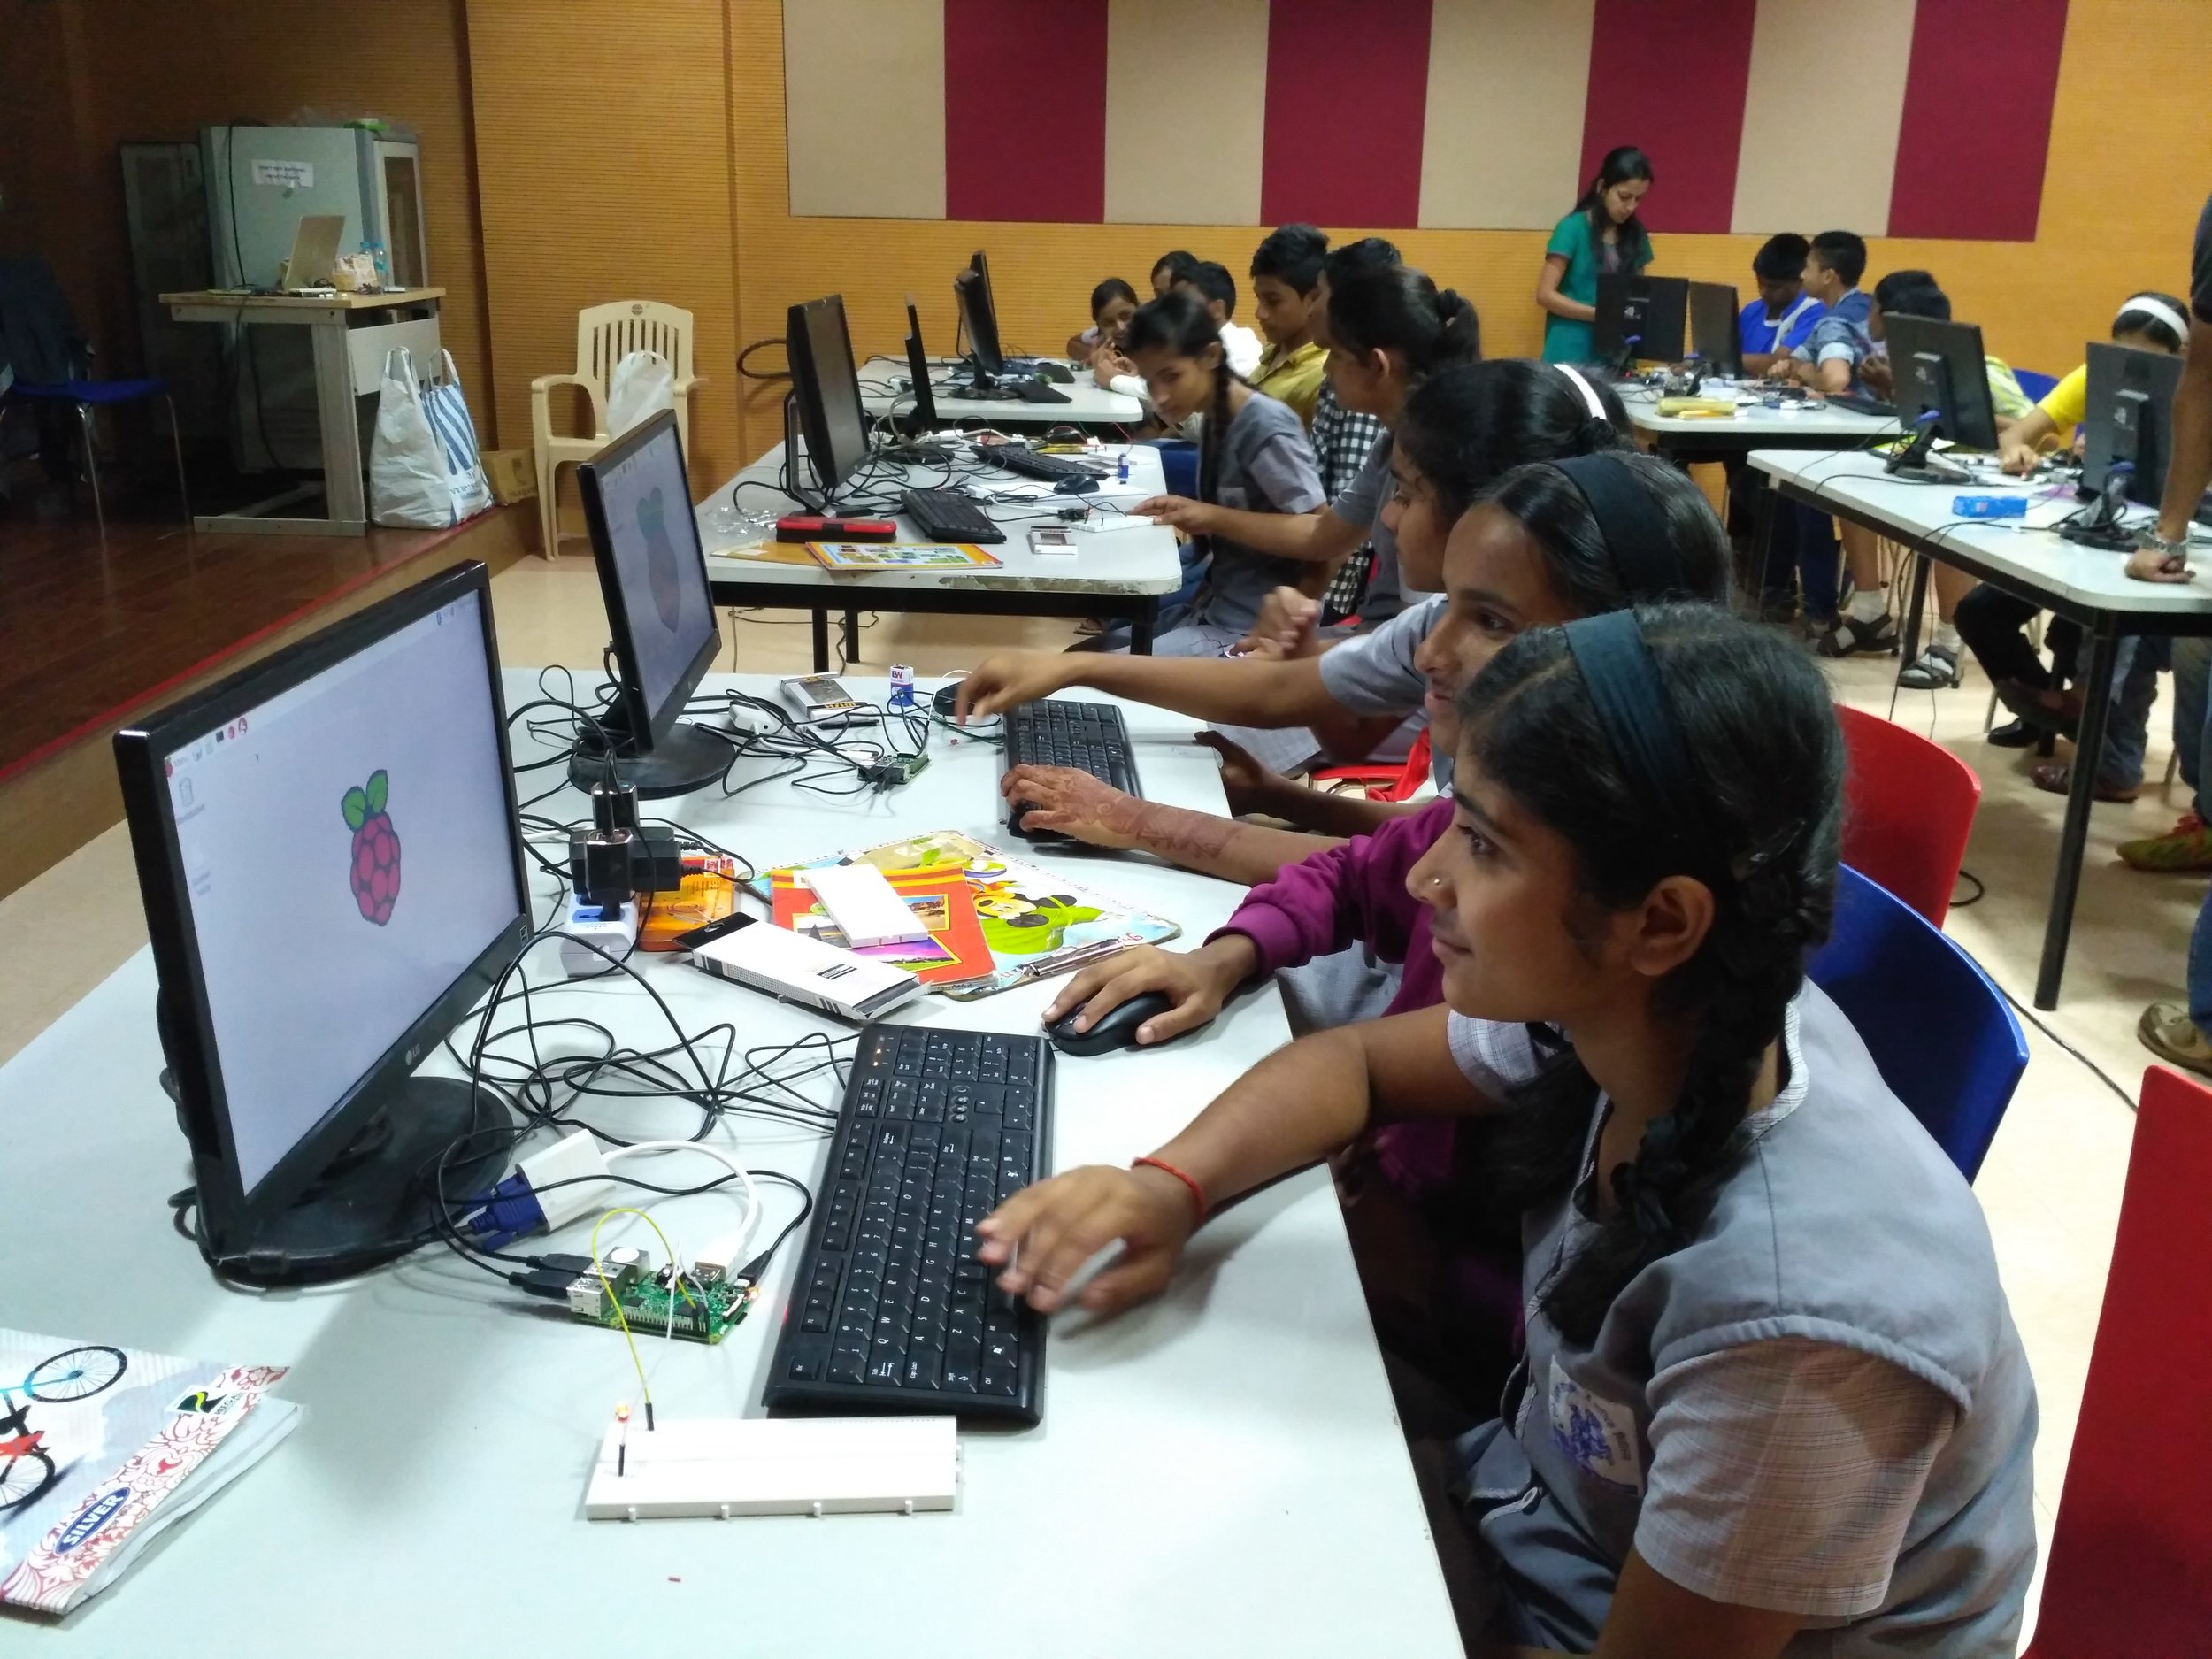
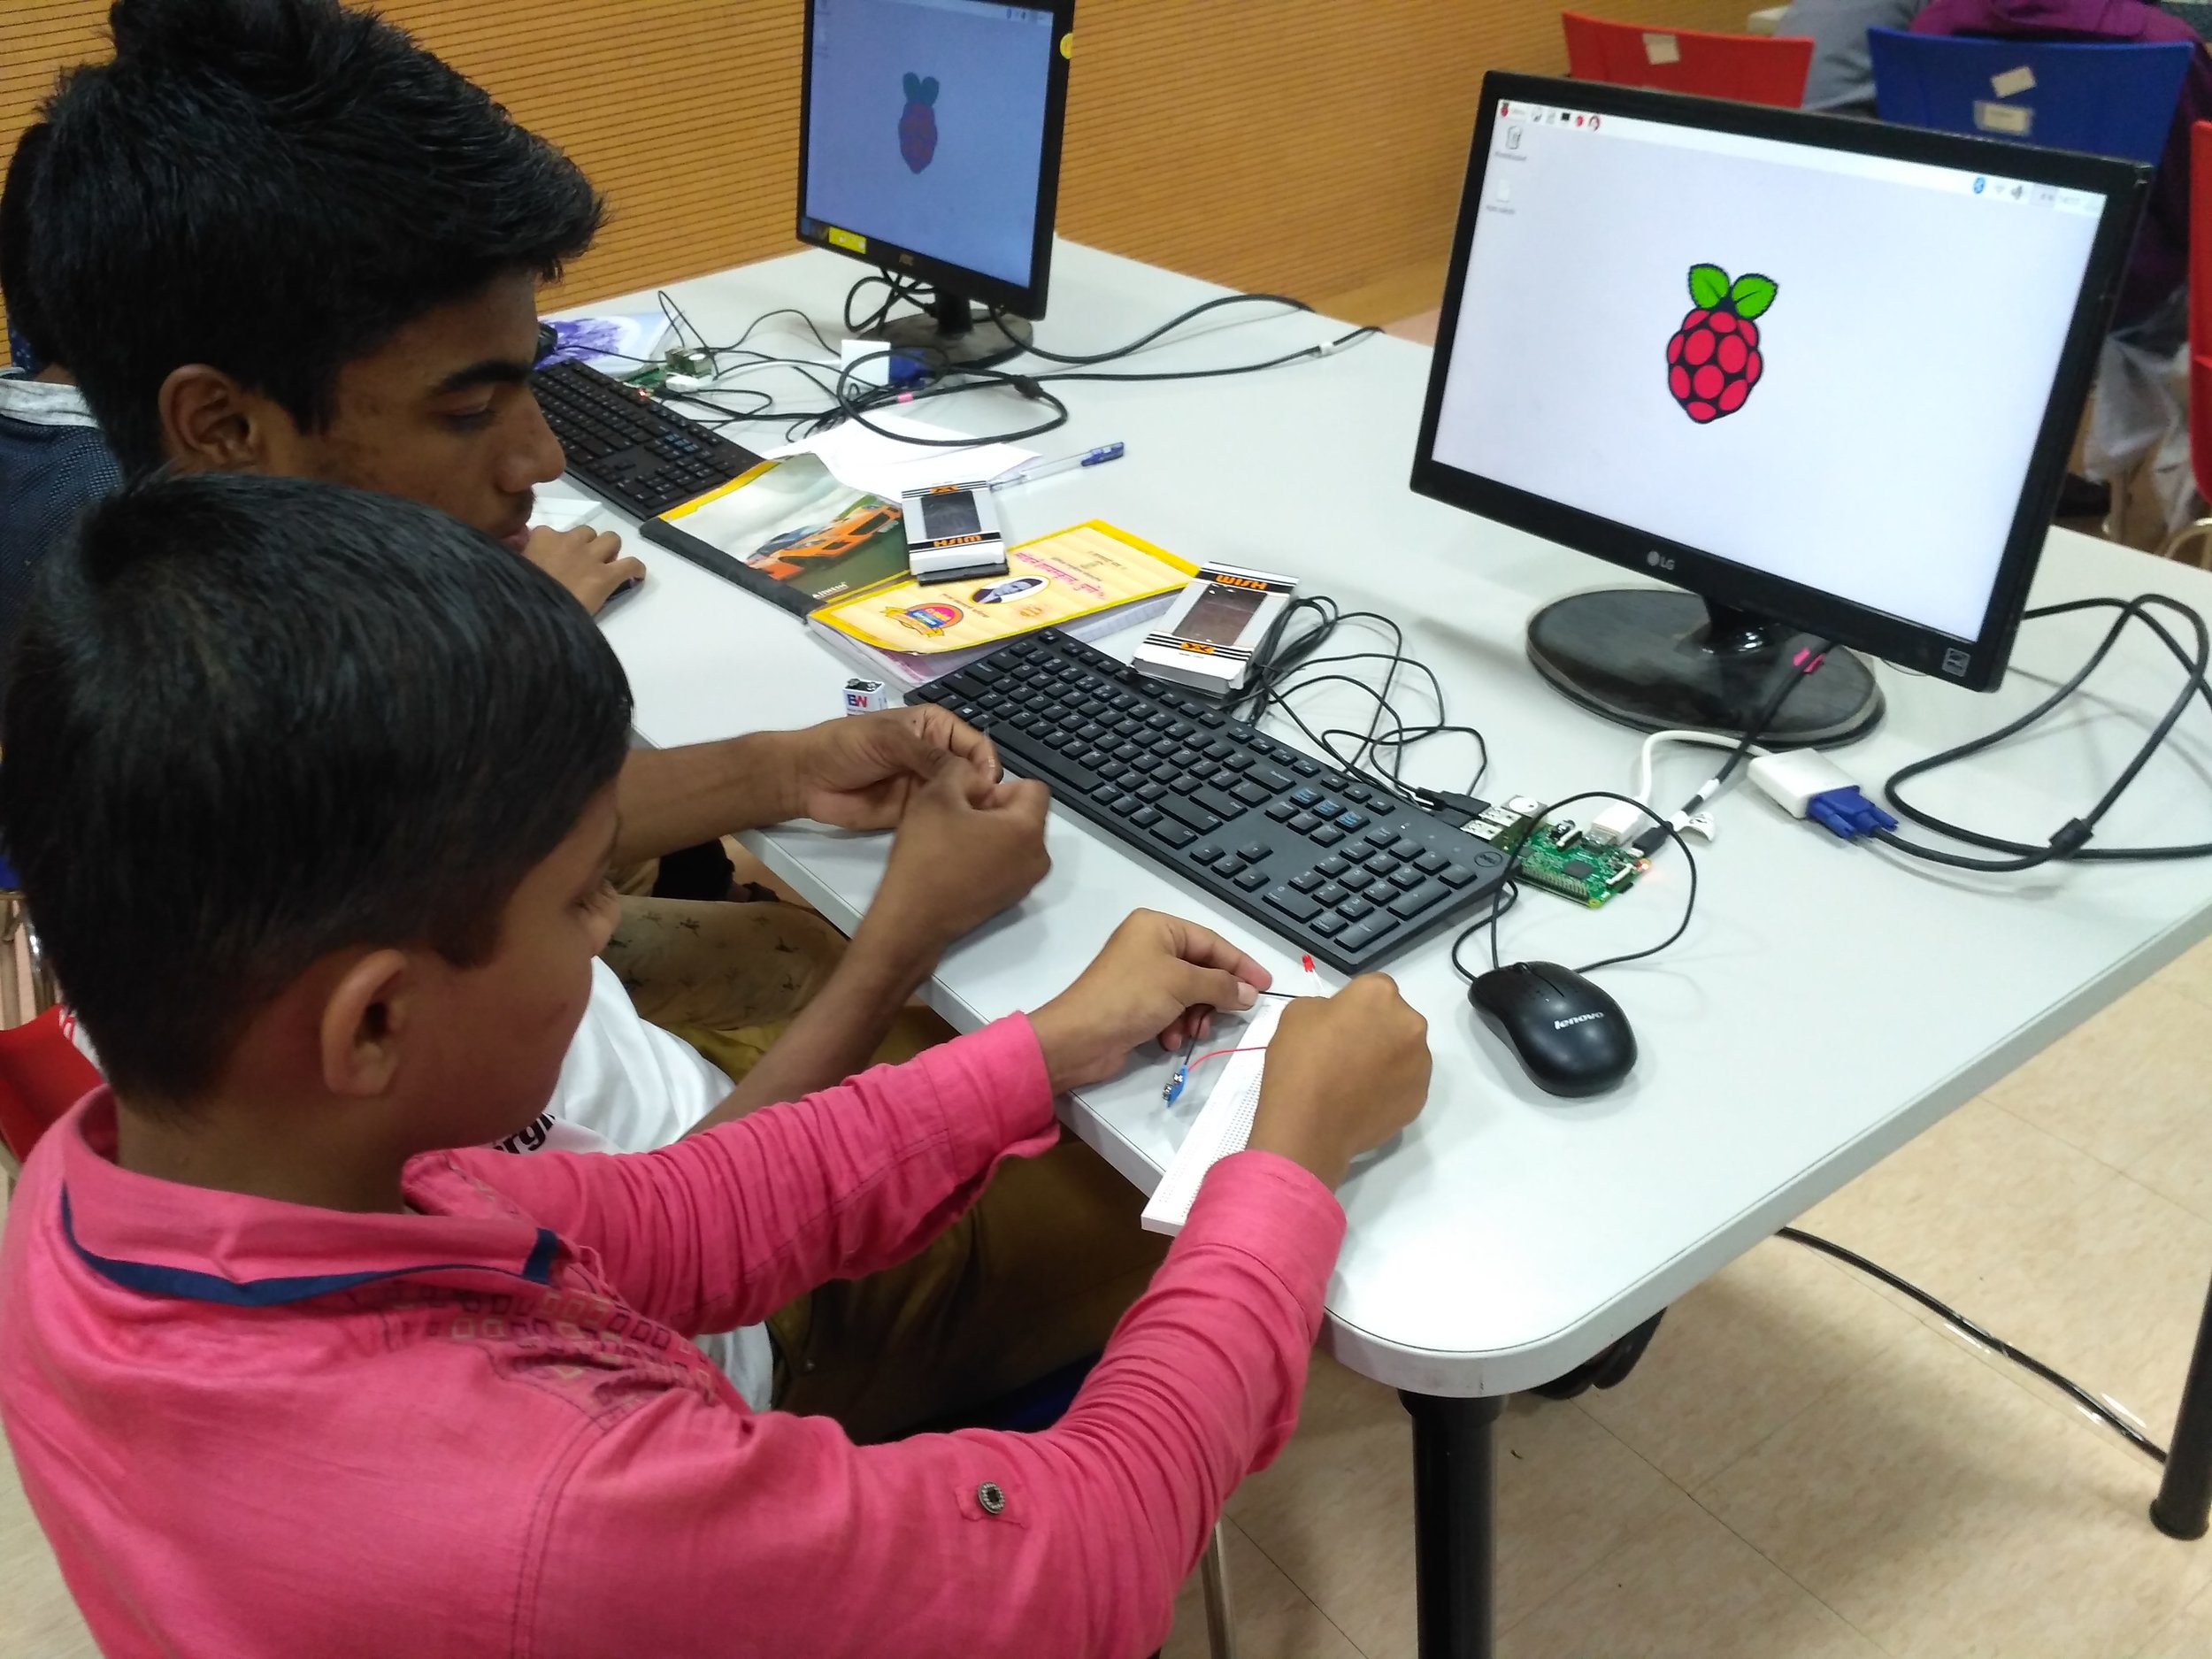
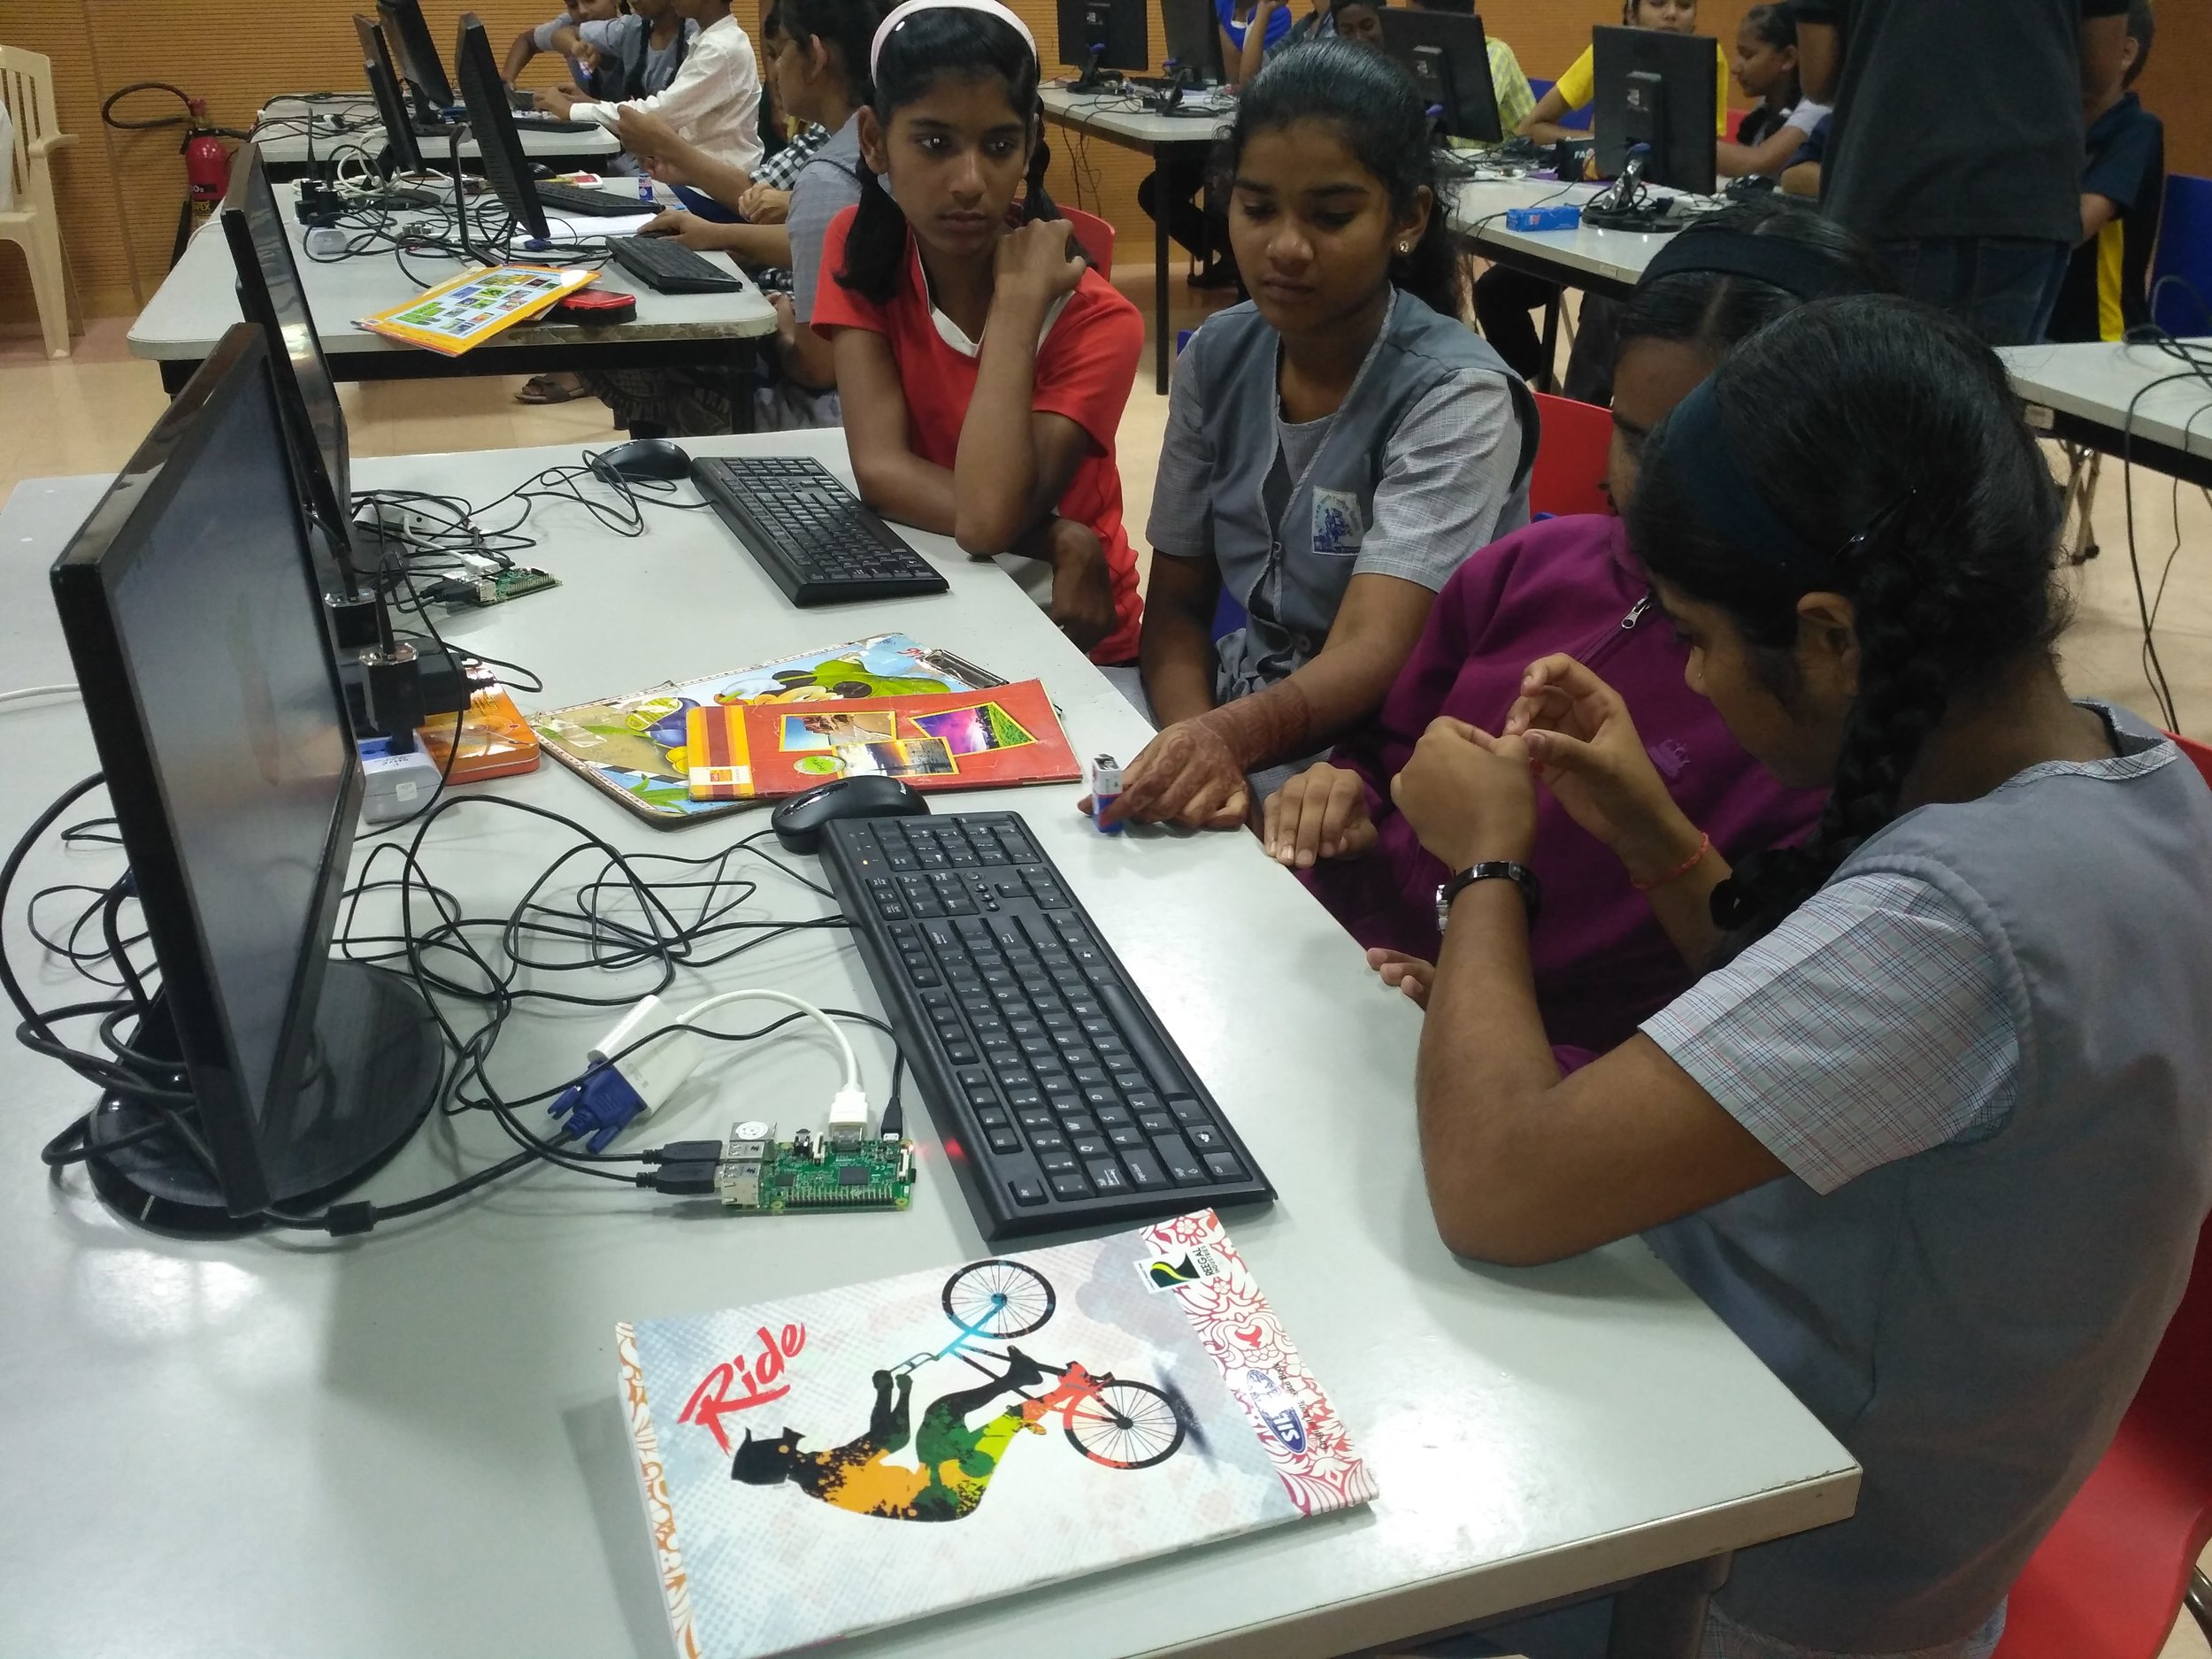
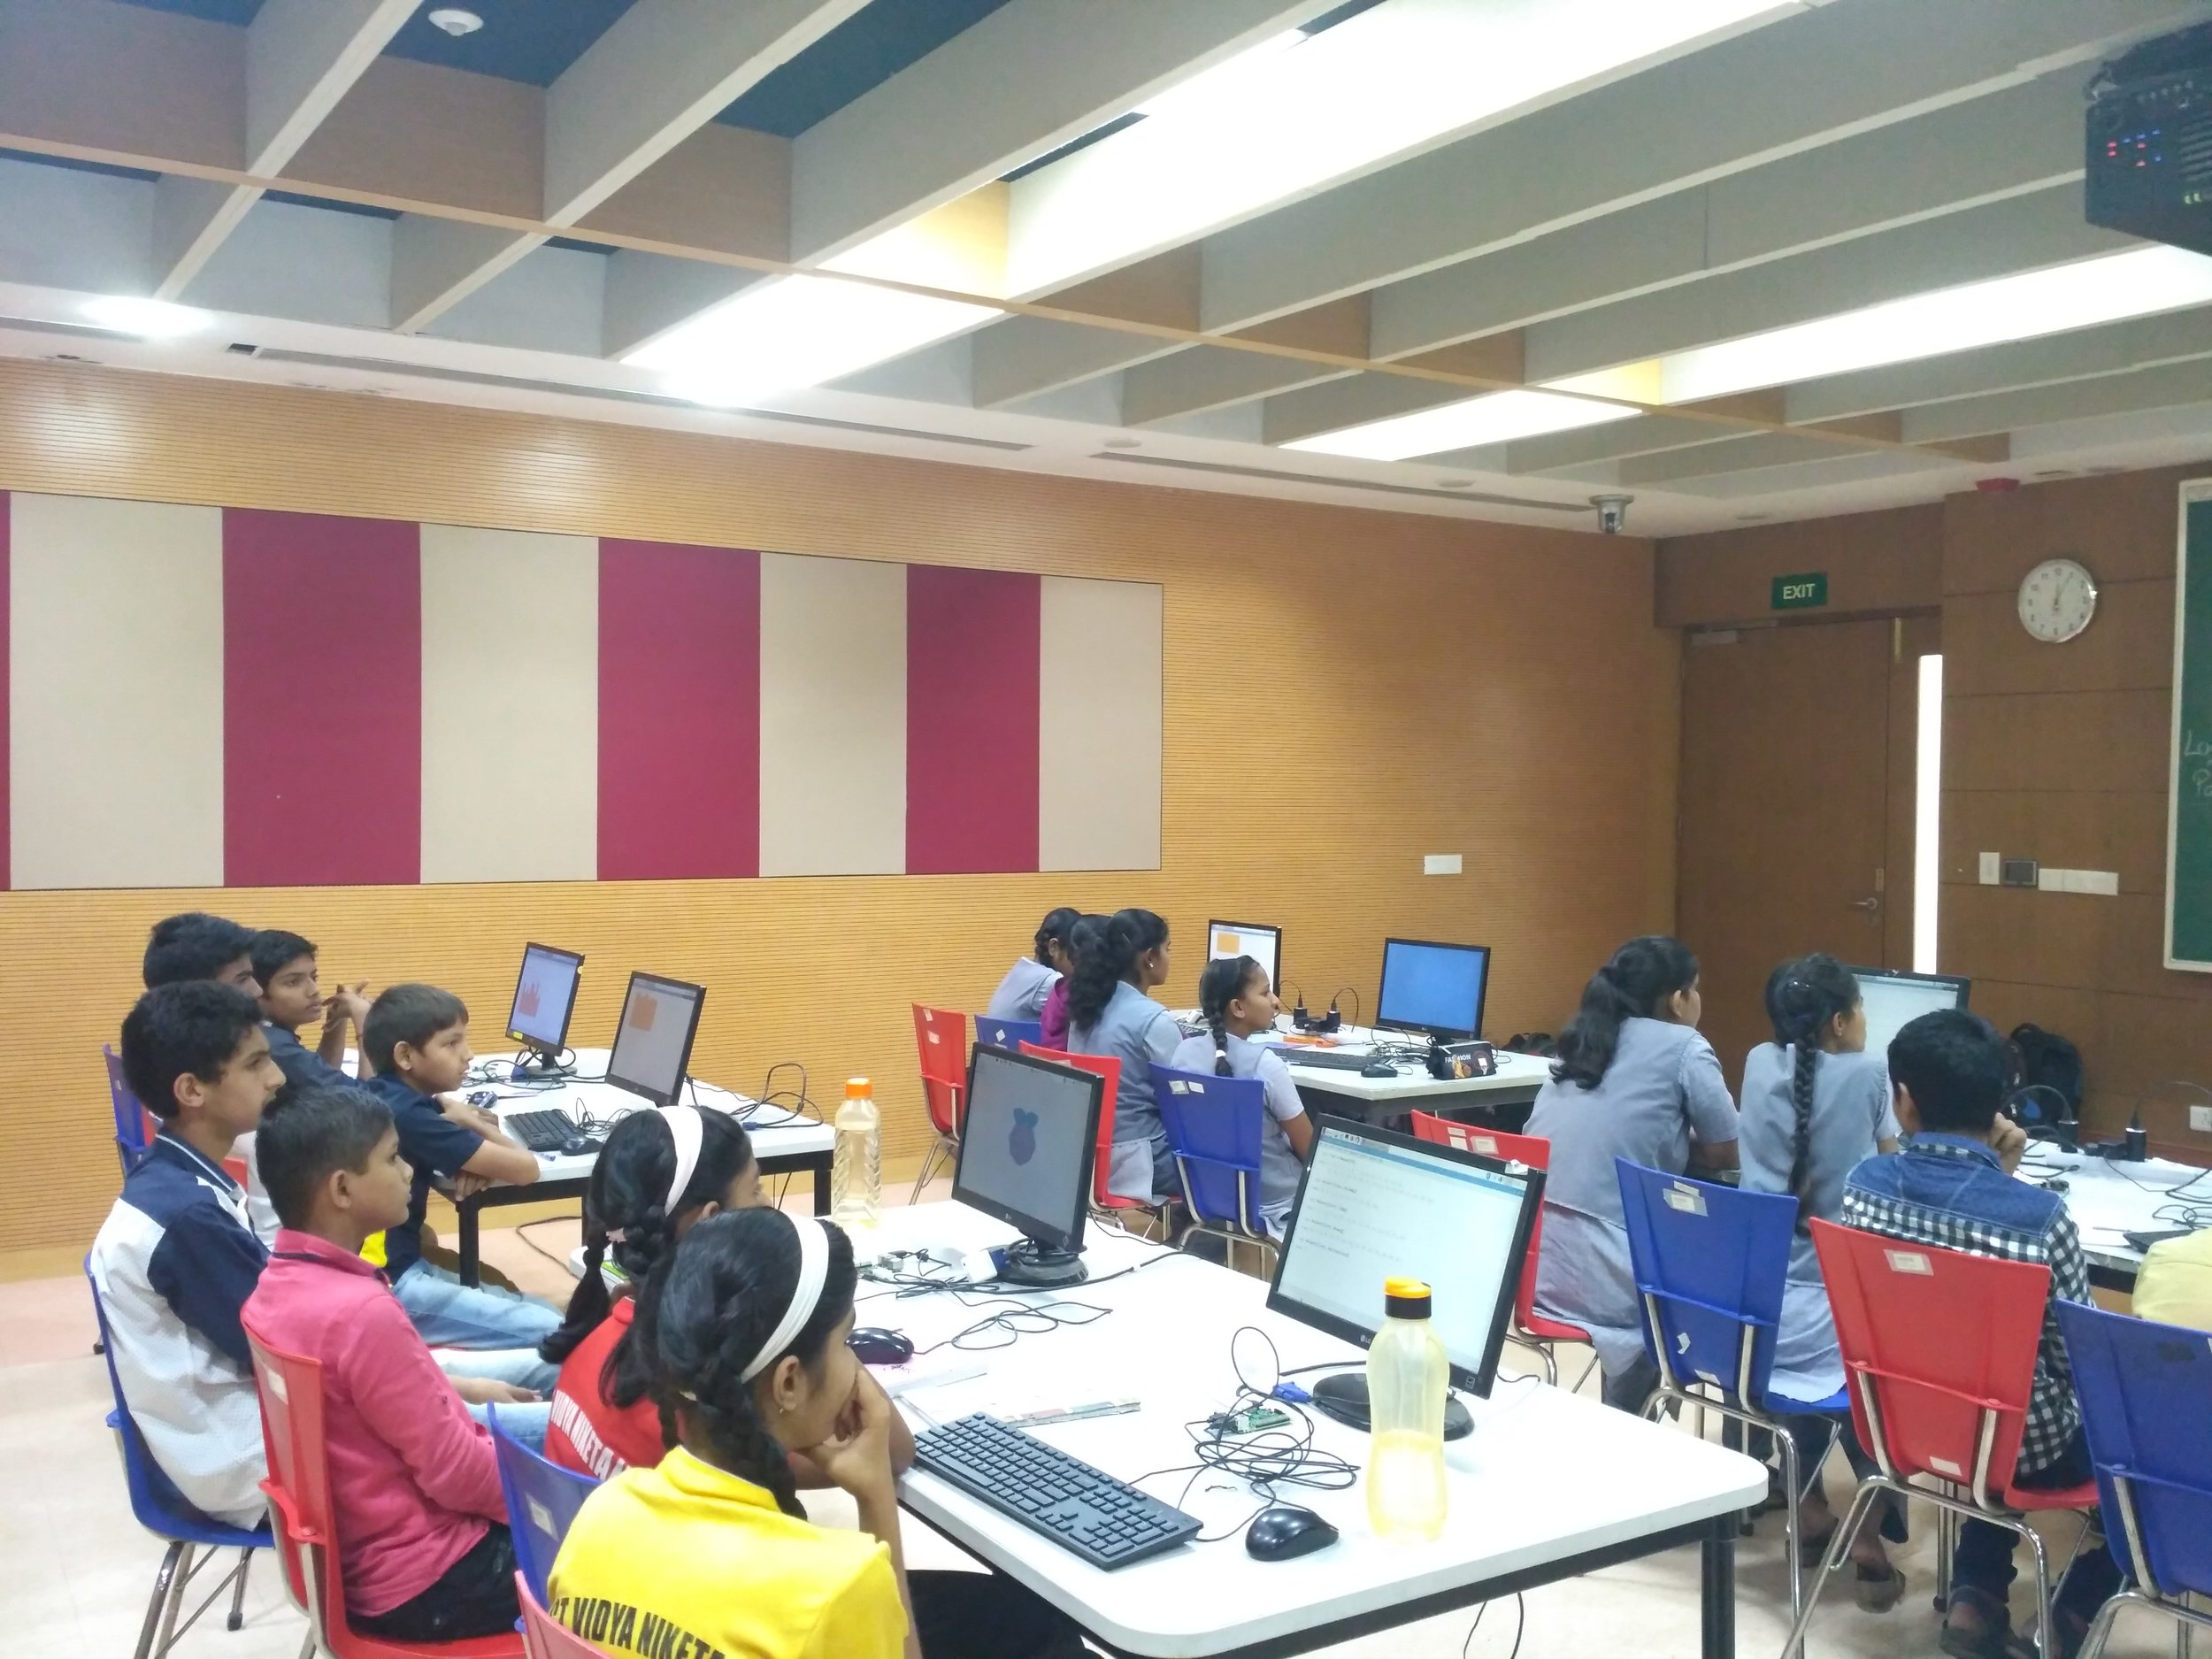
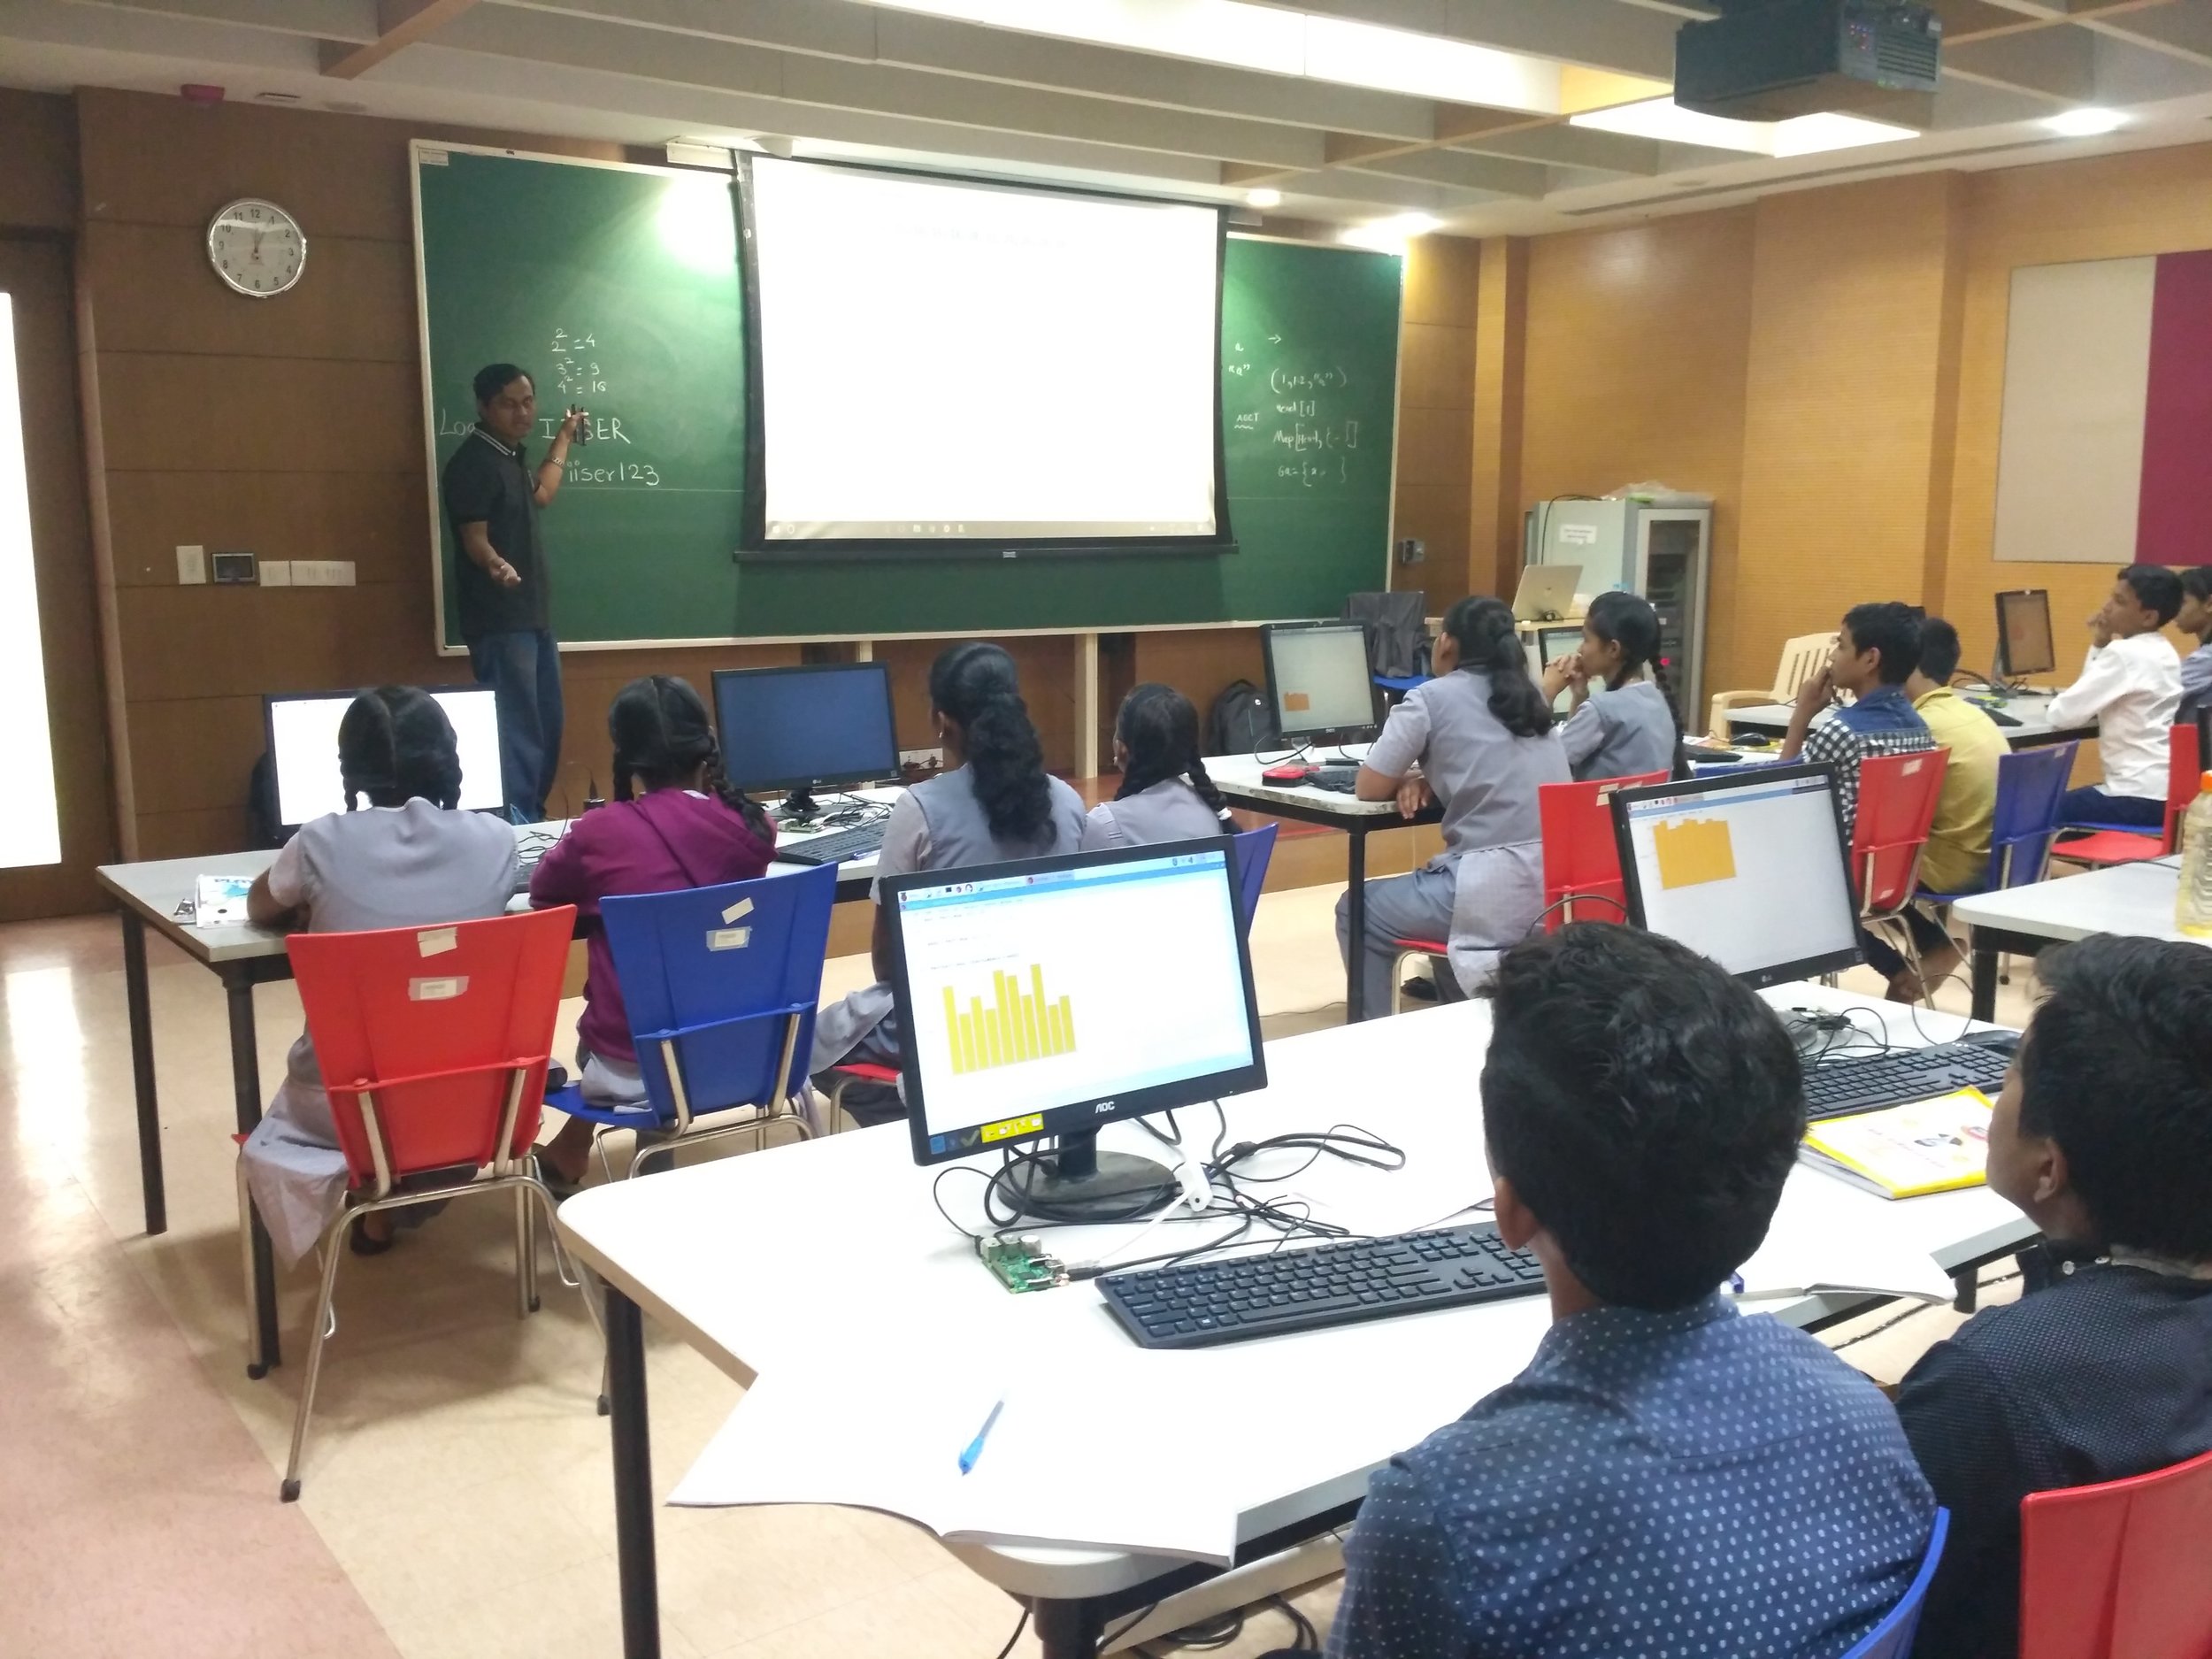
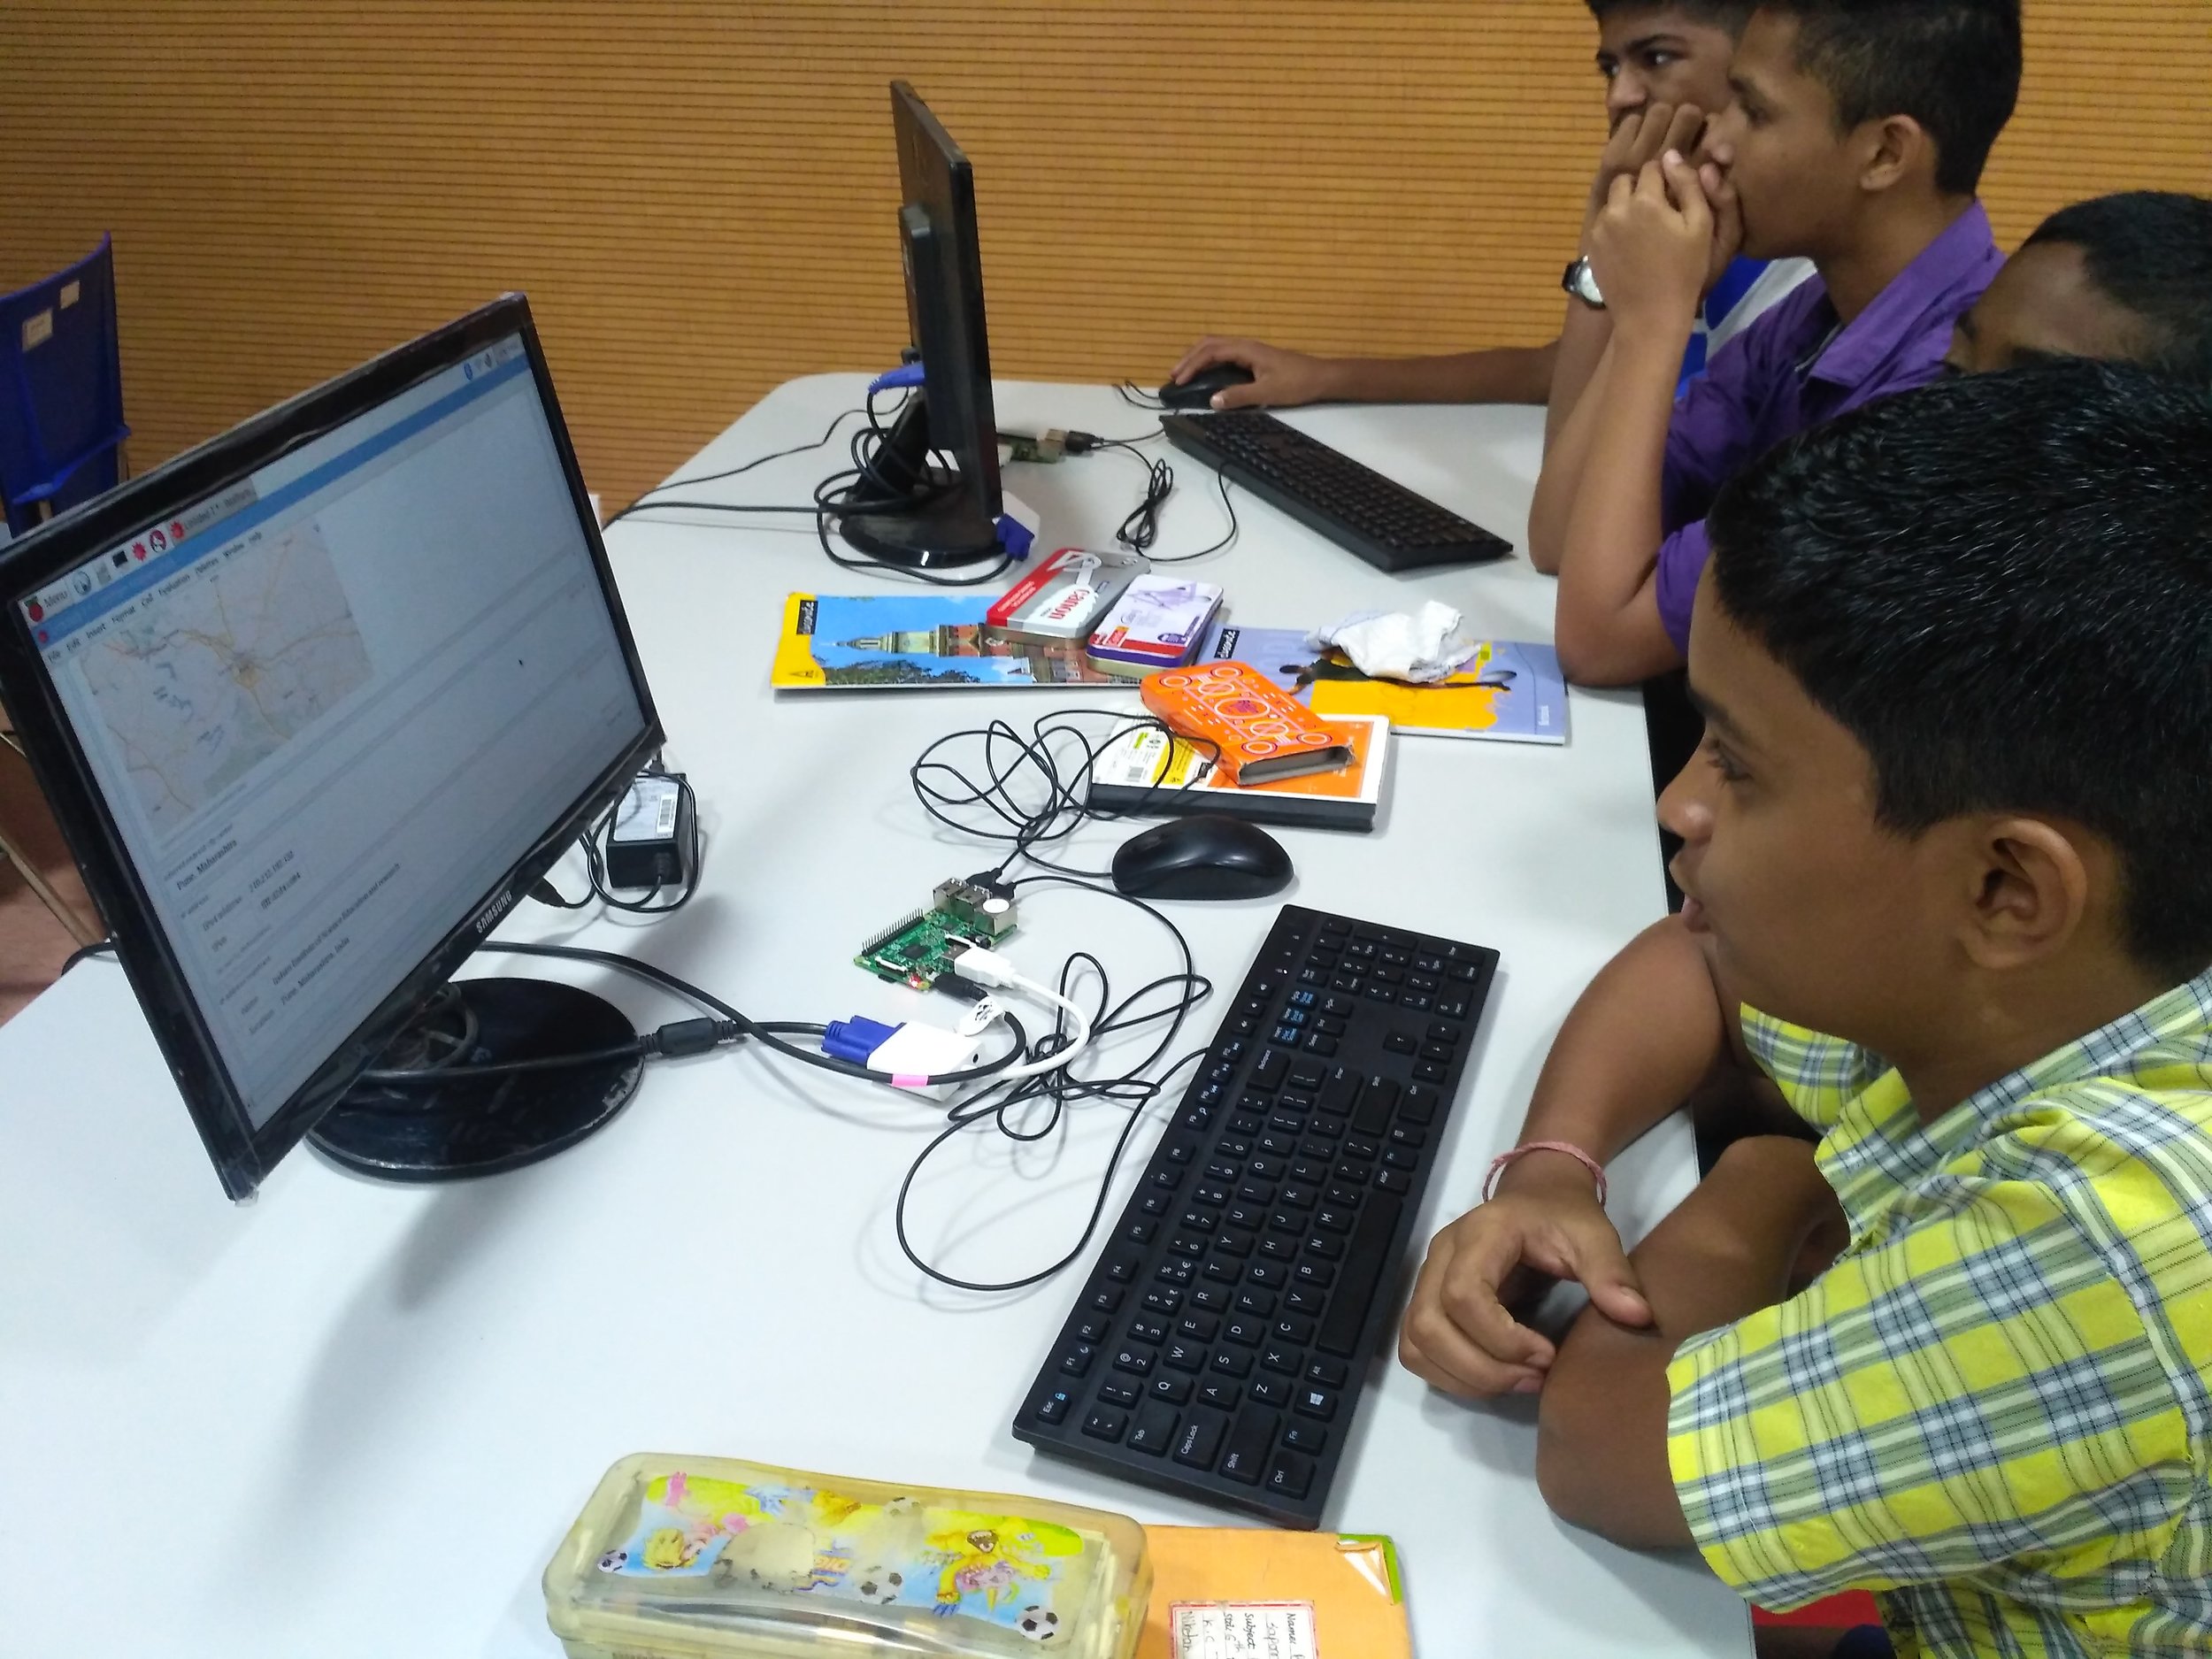
A couple weeks back I conducted a Raspberry Pi workshop for the students of Pune Municipal Corporation [PMC] schools. The workshop was arranged at IISER by Exciting Science Group [ESG]. A total 24 students from three PMC schools [Hutatma Balveer Shrishkumar, K.C. Thackeray Vidyaniketan, Dr Vasantdada Patil Vidyaniketan] attended the workshop. 

During the workshop, students learned how to use command line interface, how to solve problems with Wolfram|Alpha- a computable search engine on Raspberry Pi. Once they become a little comfortable in using the device, they were introduced to Mathematica and Wolfram programming language that are freely available on Raspberry Pi. Students successfully learned to calculate even, odd, and prime numbers using Mathematica.

Later on they wrote programs for simple conversions like Fahrenheit to Celsius, and more advanced like finding Palindrome numbers and Perfect Numbers. They also learned about GPIO and to connect LEDs to different pins on Raspberry Pi. Here are the few pics from the workshop-

The Mystery and Music of Kaprekar Constant- 6174

In 1949, Indian mathematician D.R. Kaprekar from Devlali (Nashik) came up with an interesting routine, the procedure now known as Kaprekar routine. This routine when applied to any positive four digit number [all the digits should not be similar], converges to the same number 6174 in at most seven steps. To understand the routine, let us follow this procedure:

  1. Take any four digit number [in base 10], let’s say 1234.
  2. Arrange these digits in descending order. [In our example, it will be 4321]
  3. Now rearrange the digits in ascending order [i.e. 1234]
  4. Subtract the smaller number from bigger to get a new number.
  5. Repeat the above procedure for each new number you get.  

Let us work out with our first example.

1) 4321 - 1234 = 3087
2) 8730 - 0378 = 8352
3) 8532 - 2358 = 6174
4) 7641 - 1467 = 6174

When we reach the number 6174, the operation repeats itself, returning 6174 every time. This 6174 number is known as Kaprekar constant.

Let’s try with another number- How about this year as four digit number- 2014

1) 4210 - 0124 = 4086
2) 8640 - 0468 = 8172
3) 8721 - 1278 = 7443
4) 7443 - 3447 = 3996
5) 9963 - 3699 = 6264
6) 6642 - 2466 = 4176
7) 7641 - 1467 = 6174

First example [1234] reached the number 6174 in 3 steps while the second one [2014] reached in 7 steps. In fact all the four digit numbers reach the mysterious number 6174 at most 7 steps. This is the beauty of Kaprekar constant.

Now there are 10000 four digit numbers. How many iterations would be required for every number to reach a fixed point ? Let us try to find out.

In Mathematica, we will write a function called kaprekar which will calculate the number of iterations required for any four digit number to reach the kaprekar constant 6174:

kaprekar[n_Integer] := 
Module[{a = Rest[Most[FixedPointList
[(FromDigits[Reverse[Sort[IntegerDigits[#, 10, 4]]]] - FromDigits[Sort
[IntegerDigits[#, 10, 4]]]) &, n]]]},LengthWhile[a, # > 0 &]]

(Note that numbers having fewer than 4 digits are padded with leading 0s, i.e. 1 will be written as 1000 or 41 will be 4100.)

Let’s check for the number 2014:

kaprekar[2014] = 7 

Indeed as we have seen earlier, the number 2014 takes 7 steps to reach a fixed value. Now we will run this program for every number from 0 to 10000 to determine the number of iterations to reach kaprekar constant.

We will arrange these numbers into a 100 x 100 grid and assign a specific color to each of these numbers.

Colors assigned to the no. of iterations to reach Kaprekar constant
Data = Partition[kaprekar[#] & /@ Range[0, 10000], 100]; 
(* Map each value to a specific color *)
colors={0 -> RGBColor[1, 1, 1], 1 -> RGBColor[1, 6/7, 0], 
 2 -> RGBColor[2/7, 1, 0], 3 -> RGBColor[0, 1, 4/7], 
 4 -> RGBColor[0, 4/7, 1], 5 -> RGBColor[2/7, 0, 1], 
 6 -> RGBColor[1, 0, 6/7], 7 -> RGBColor[1, 0, 0]};

ArrayPlot[Reverse[Data], ColorRules -> colors, ImageSize -> 800, Mesh -> All, 
MeshStyle -> Black, Frame -> True, 
FrameTicks -> {{Range[0, 100, 20], None}, {Range[0, 100, 20], None}}, 
DataRange -> {{0, 99}, {0, 99}}, 
BaseStyle -> Directive[FontFamily -> "Gill Sans", 12], FrameLabel -> 
TraditionalForm /@ {Floor[n/100], Mod[n, 100]}]
The number of steps required for the Kaprekar routine to reach a fixed point for values of n = 0 to 9999, partitioned into rows of length 100. Numbers having fewer than 4 digits are appended with leading 0s, resulting in all values converg…

The number of steps required for the Kaprekar routine to reach a fixed point for values of n = 0 to 9999, partitioned into rows of length 100. Numbers having fewer than 4 digits are appended with leading 0s, resulting in all values converging to 6174.

This figure was first appeared on the cover page of Mathematics Teacher [Math. Teacher 98, 234-242, 2004].

Now let’s put green color to the even numbers in the above figure and blue color to the odd numbers.

ArrayPlot[Reverse[Data], ColorRules -> {_?EvenQ -> Green, _?OddQ -> Blue}, 
ImageSize -> 800, Mesh -> All, MeshStyle -> Black, Frame -> True,
FrameTicks -> {{Range[0, 100, 20], None}, {Range[0, 100, 20], None}},
DataRange -> {{0, 99}, {0, 99}},
BaseStyle -> Directive[FontFamily -> "Gill Sans", 12],
FrameLabel -> TraditionalForm /@ {Floor[n/100], Mod[n, 100]}]
                                                                  Even numbers are c…

                                                                  Even numbers are colored in green while odd ones are blue colored.

How about coloring the prime numbers as green and rest of them as blue? What kind of pattern does it show? Let's find out- 

ArrayPlot[Reverse[Data], 
ColorRules -> {_?PrimeQ -> Green, Except[_?PrimeQ] -> Blue},
ImageSize -> 800, Mesh -> All, MeshStyle -> Black, Frame -> True,
FrameTicks -> {{Range[0, 100, 20], None}, {Range[0, 100, 20], None}},
DataRange -> {{0, 99}, {0, 99}},
BaseStyle -> Directive[FontFamily -> "Gill Sans", 12],
FrameLabel -> TraditionalForm /@ {Floor[n/100], Mod[n, 100]}]
                                                         Prime numbers are colored as green while rest o…

                                                         Prime numbers are colored as green while rest of the numbers are colored as blue.

Now how about making Kaprekar music. There are some wonderful attempts to convert the digits of mathematical constant Pi to musical sequence [check Michael John Blake- A musical interpretation of pi, and Lucy Kaplansky - Song About Pi]. The major scale consists of 7 notes from any chromatic scale and we have already seen that the Kaprekar constant can be reached at the most 7 iterations. We will assign a note to each number [i.e. iterations needed to reach 6174] and play the musical sequence. Let us try on the sequence of numbers generated in the Kaprekar routine for first 100 numbers. 

Sound[SoundNote[#] & /@ (kaprekar[#] & /@ Range[100]), 20]

Sounds nice. Now let's quantize the audio with the parameter 1/16 Swing D. [I used Garageband for this.] 

Now we will find out the sequence of Kaprekar transformations leading to 6174 in all four digit numbers.

kaprekarSequence[x_] := 
Rest[Most[
FixedPointList[(FromDigits[Reverse[Sort
[IntegerDigits[#, 10, 4]]]] -
FromDigits[Sort[IntegerDigits[#, 10, 4]]]) &, x]]];
data = Partition[#, 2, 1] & /@(kaprekarSequence[#] & /@ Range[10000]);  
rules = Map[Apply[Rule, #] &, data, {2}];
kpSequence = Cases[Tally[Rules], {x_List, y_} -> x];
TreePlot[Flatten[kpSequence], ImageSize -> 1000, 
VertexRenderingFunction -> ({White, EdgeForm[LightGray], Disk[#, {.2, .125}],
Black, Text[#2, #1]} &), PlotStyle -> Orange,
BaseStyle -> {FontFamily -> "Gill Sans", 12}]
                                                      Flow chart for Kaprekar sequence for four digit numbers [in …


                                                     Flow chart for Kaprekar sequence for four digit numbers [in base 10]

We can find the frequency of each route by-

bardata = 
Sort[Cases[ Tally[kaprekarSequence[#] & /@Range[10000]],
{x_List, y_} /; Length[x] > 0 && First[x] != 0 :> {Length[x], First[x], y}]]
values = Split[bardata, First[#1] === First[#2] &] 
BarChart[values[[#]][[All, 3]] & /@ Range[7, 1, -1], BarOrigin -> Left, 
AspectRatio -> 0.9, ChartBaseStyle -> EdgeForm[LightGray],
ChartStyle -> {{Red, Orange, Blue, Gray, Magenta, Purple}, None},
ImageSize -> 800, BaseStyle -> {FontFamily -> "Gill Sans", 10},
PlotRange -> {{0, 500}, Automatic}, Ticks -> {Range[0, 500, 100], Automatic},
BarSpacing -> Medium]
 Frequency of Kaprekar sequence  for four digit numbers [in base 10]. The numbers at the left denotes the number of steps required to reach the Kaprekar constant.


Frequency of Kaprekar sequence  for four digit numbers [in base 10]. The numbers at the left denotes the number of steps required to reach the Kaprekar constant.

References

  1. Kaprekar DR (1955). An Interesting Property of the Number 6174. Scripta Mathematica, 15:244-245.

  2. Kaprekar DR (1980). On Kaprekar Numbers. Journal of Recreational Mathematics, 13(2):81-82.

  3. Deutsch, D. and Goldman, B. (2004). Kaprekar's Constant. Mathematics Teacher 98: 234-242.

Forecast Widget

Forecast.io is a stunning web app where you can get minute-by-minute forecasts along with beautiful maps and rain animations [minute updates works for few regions but more coverage seems to be coming very soon]. Apart from that it's actually a global weather service where you can get the weather data for any location on earth through their data api.
And here is the weather forecasts for Suwon [S. Korea] & Pune [India] city.